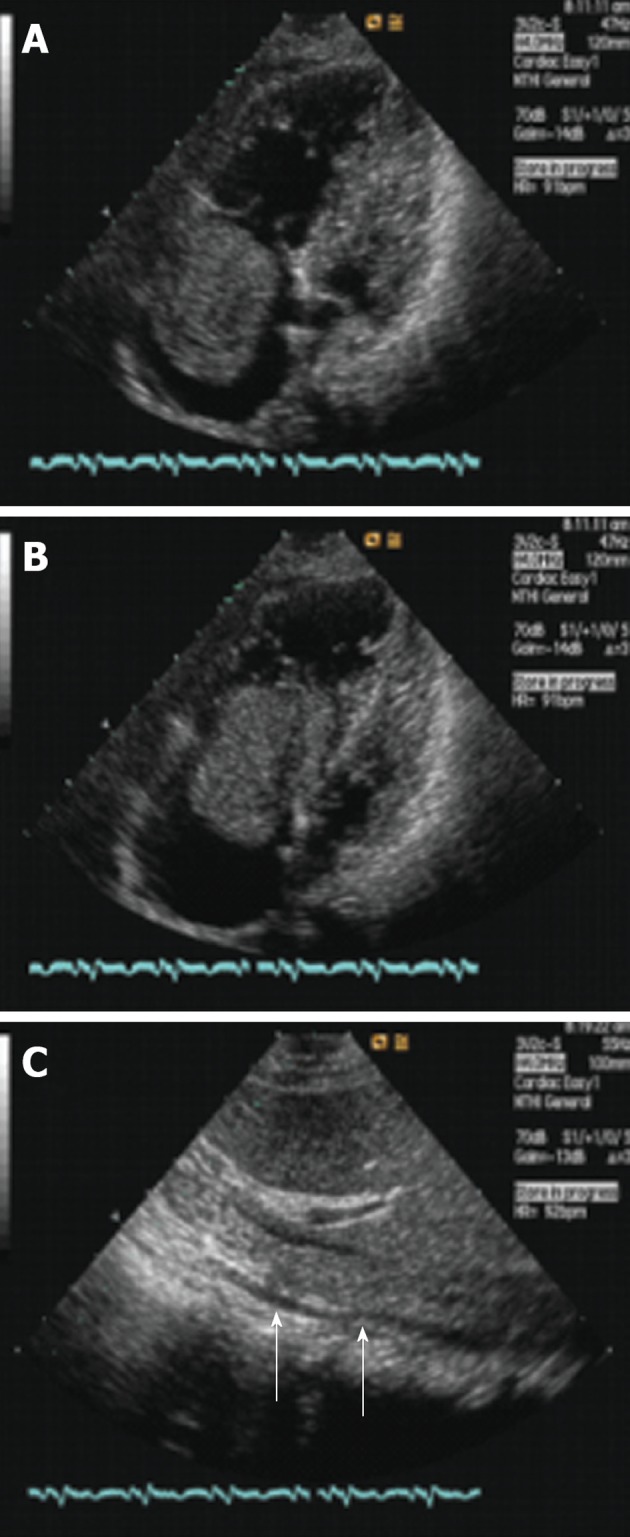
Figure 1.

Echocardiogram of the heart and inferior vena cava. A, B: Axial image demonstrates a mass within the right atrium that moves back and forth through the tricuspid orifice into the right ventricle in the systolic and diastolic period; C: Axial image demonstrates a mass within the inferior vena cava (arrows).
