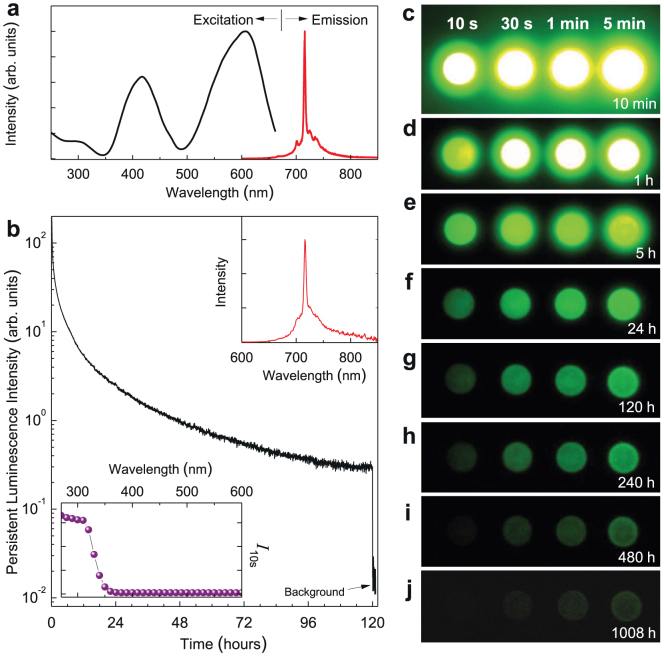
Figure 1. Photoluminescence and persistent luminescence of LiGa5O8:Cr3+ phosphor discs at room temperature.
(a) Normalized excitation and emission spectra for photoluminescence. The emission spectrum is acquired under 400 nm light excitation and the excitation spectrum is obtained by monitoring 716 nm emission. (b) NIR persistent luminescence decay curve monitored at 716 nm after irradiation by 300 nm light for 20 min. The upper inset shows the persistent luminescence emission spectrum recorded at 1 h after the stoppage of the irradiation. The bottom inset is the persistent luminescence excitation spectrum obtained by plotting the persistent luminescence intensity (I10s) monitored at 716 nm as a function of the excitation wavelengths over the 250–600 nm spectral range. The disc was irradiated for 5 min at each measured wavelength using a xenon arc lamp. (c–j) NIR images of four phosphor discs taken at different persistent luminescence times (10 min to 1,080 h) after irradiated by a 254 nm lamp for 10 s to 5 min. The imaging parameters are: (c–f) manual/ISO 400/10 s, (g–i) manual/ISO 800/30 s, and (j) manual/ISO 1600/30 s.

