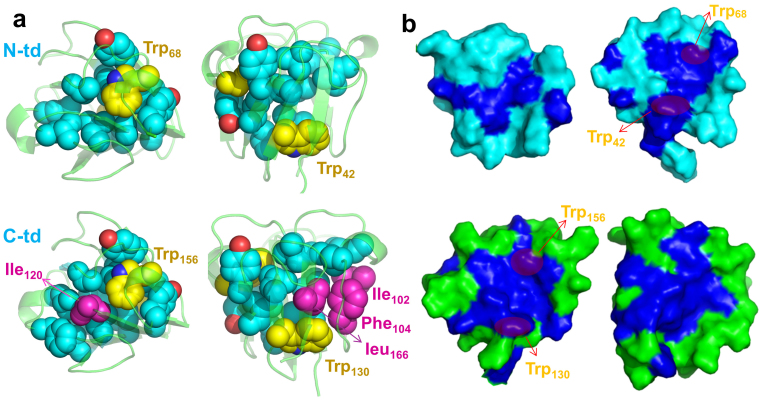
Figure 4.
(a) The hydrophobic central region of each domain. The backbone is represented as cartoon (green) and all the non-polar residues in the dry central region are represented as spheres (cyan). Trp is colored yellow; the additional non-polar residues in C-td are colored in magenta. (b) The inner surface of two domains. The hydrophobic residues are colored in blue and the rest residues are colored in green (C-td) or cyan (N-td).

