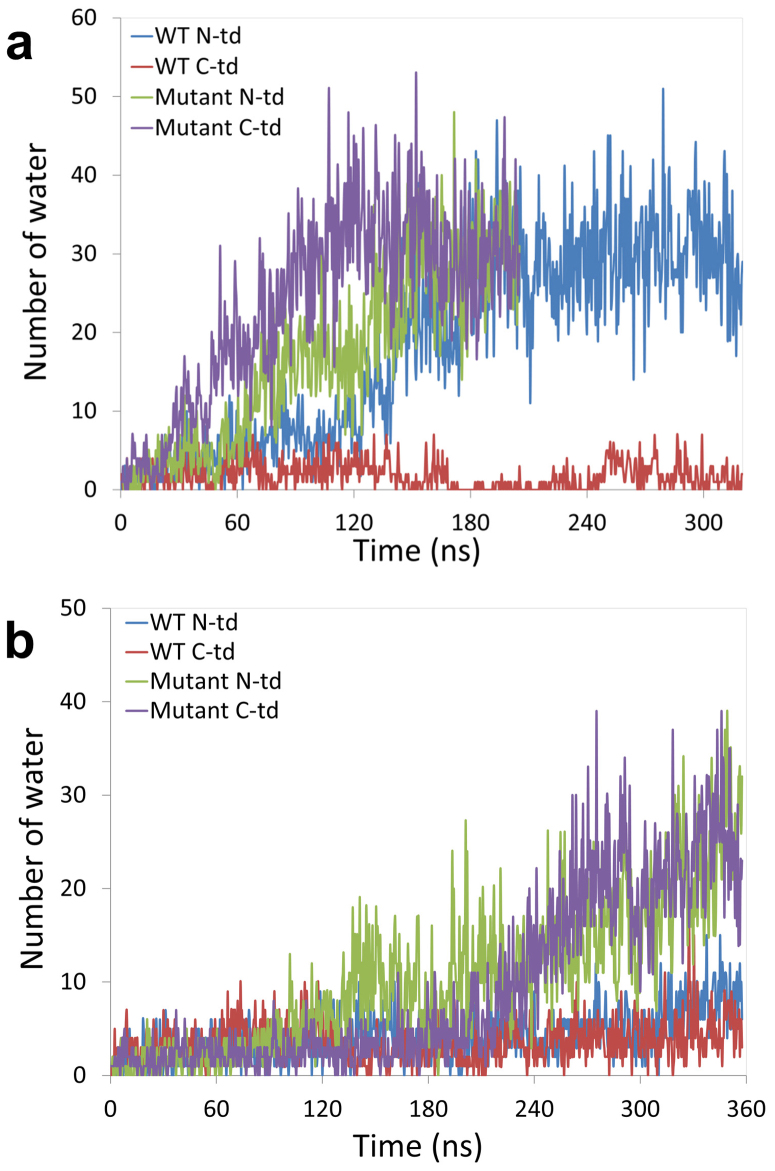
Figure 6. The time evolution of water dynamics in each hydrophobic central region for both the wild-type and the quadruple KN mutant.
The number of water inside N-td and C-td hydrophobic central region is counted along the simulation time. MD simulations were performed at two tempratures: (a) 425 K and (b) 380 K.

