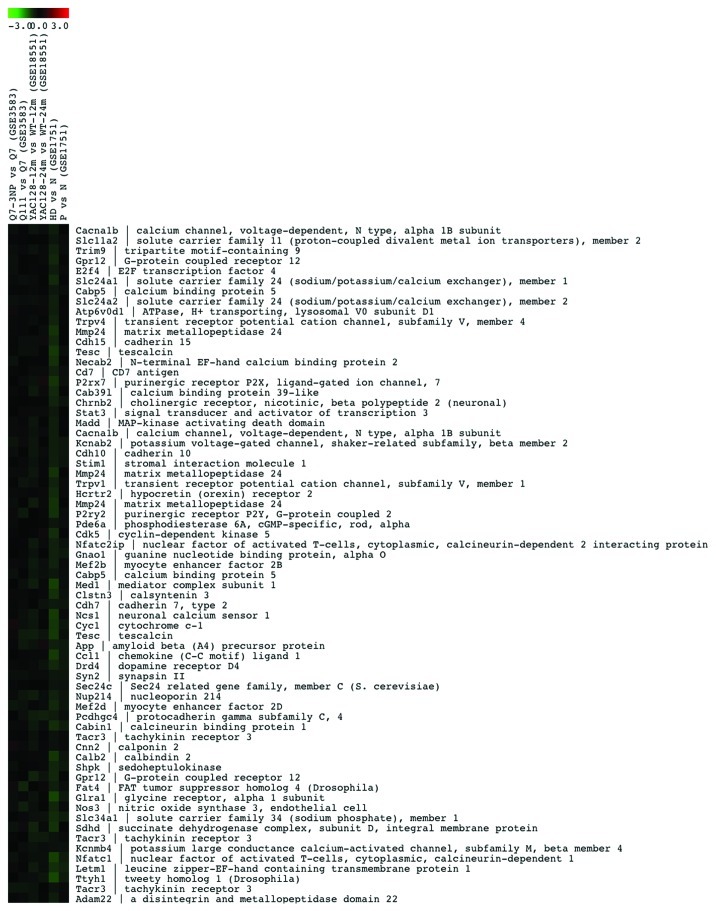
Figure 2. List of the 67 Ca2+-related genes in cluster 22 that are downregulated in the model systems of HD shown on the top. Color-coded LogRatio from -3 to +3 is shown on the top. For each gene in the cluster the acronym and the full name is shown. MultiExperiment Viewer software54 was used for generating and plotting the clusters.

An official website of the United States government
Here's how you know
Official websites use .gov
A
.gov website belongs to an official
government organization in the United States.
Secure .gov websites use HTTPS
A lock (
) or https:// means you've safely
connected to the .gov website. Share sensitive
information only on official, secure websites.
