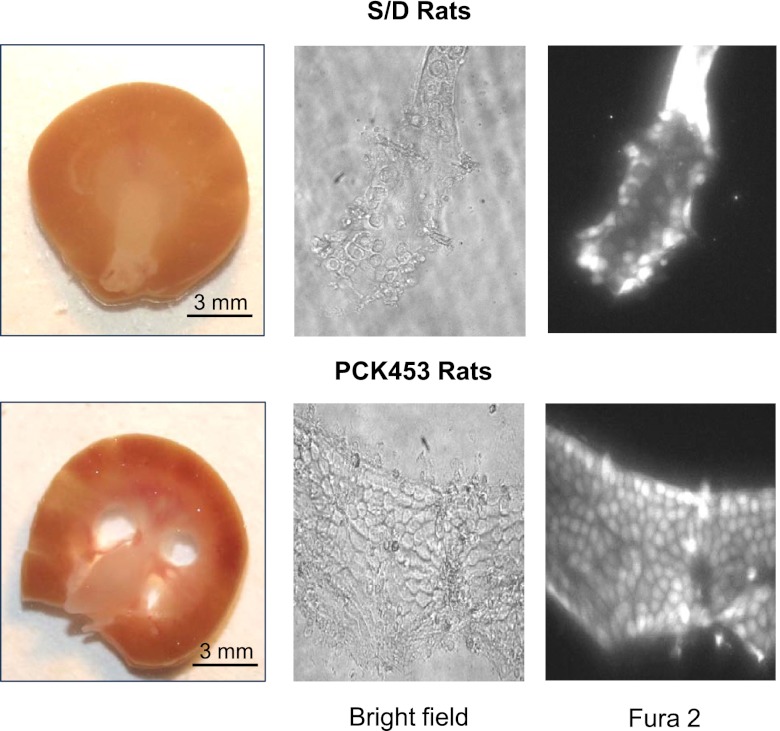
Figure 1.
Ca2+ imaging in individual cells of normal CDs and CD-derived cyst monolayers of ARPKD. The top row shows representative micrographs of a typical kidney slice (left) from a control Sprague-Dawley (S/D) rat and respective split-opened CD after loading with Fura-2 taken with bright-field illumination (middle) and 380 nm excitation (right). The bottom row shows representative micrographs of a kidney slice (left) from a PCK453 rat and respective freshly isolated CD-derived cyst monolayer after loading with Fura-2 taken with bright-field illumination (middle) and 380 nm excitation (right).

