
Figure 7.
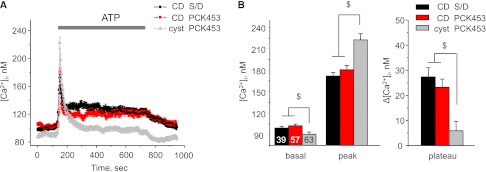
Lack of ATP-induced Ca2+ plateau in CD-derived cyst cells. (A) The average time course of [Ca2+]i changes in response to 10-minute application of ATP (10 μM, shown with a bar) for CD cells from Sprague-Dawley (S/D) rats (black), cells of nondilated CD from PCK453 rats (red), and CD-derived cyst cells from PCK453 rats (gray). (B) Summary graph of the basal [Ca2+]i values (basal), the magnitudes of ATP-induced Ca2+ peak (peak), and the absolute values of the sustained plateau phase (plateau) for cells described in Figure 6A. $Significant changes versus cyst PCK453.