
Figure 1. Photomicrographs of the histological analysis of the mice liver tissues (100× & 450×).
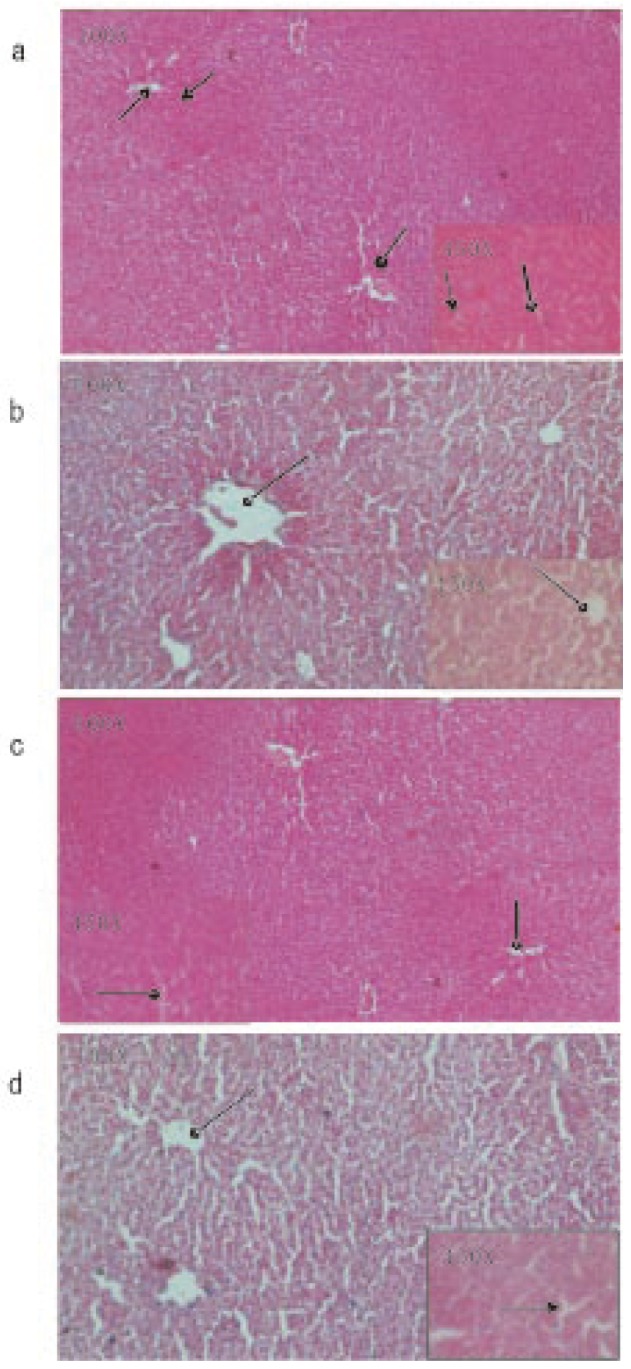
a: Control group: normal hepatic lobules ( ), central vein (
 ) and polyhedral cell (
 ); b: Nicotine-treated group (1 mg/kg bw/day): dilatation of central vein (
 ); c: CMC-EDBE-FA treated group (1 mg/kg bw/day): no dilatation of central vein (
 ); d: CMC-EDBE-FA supplemented group (1 mg/kg bw/day): repairing of dilatation of central vein (
 ).
).