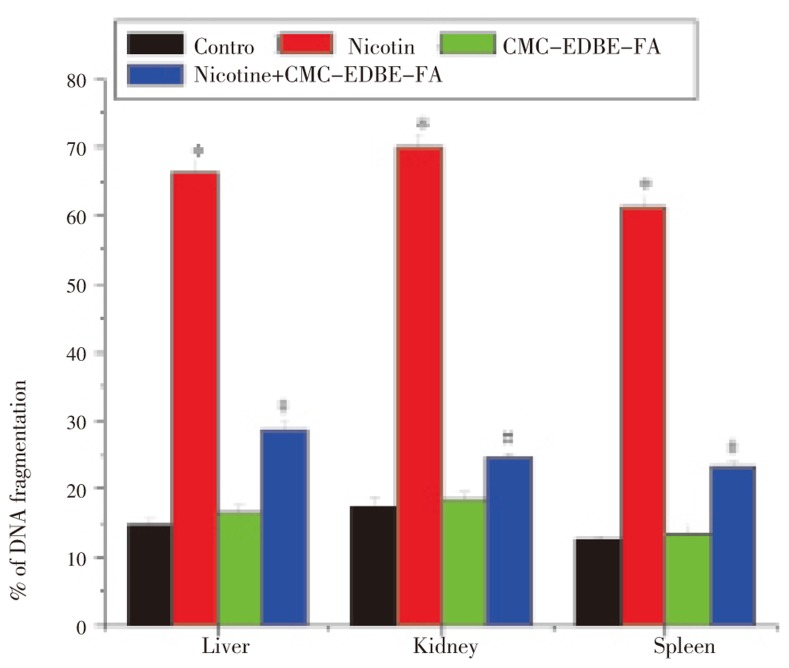
Figure 12. DNA fragmentation in control, nicotine, CMC-EDBE-FA, nicotine + CMC-EDBE-FA treated mitochondria of liver, kidney and spleen.
Values are expressed as mean±SEM, n=6. * indicates significant difference (P<0.05) compared with control group. # indicates significant difference (P<0.05) compared with nicotine treated group.

