
Figure 3. Morphological changes of the (A) MCF-7 and (B) Vero cells after E. guineensis methanol extract.
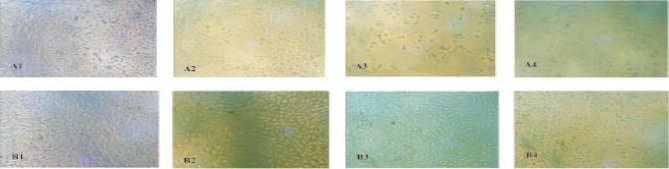
A1&B1: Control, A2&B2: 25 µg/mL, A3&B3: 50 µg/mL and A4&B4: 100 µg/mL treatment at various concentrations for 24 hours.
Official websites use .gov
A
.gov website belongs to an official
government organization in the United States.
Secure .gov websites use HTTPS
A lock (
) or https:// means you've safely
connected to the .gov website. Share sensitive
information only on official, secure websites.
A1&B1: Control, A2&B2: 25 µg/mL, A3&B3: 50 µg/mL and A4&B4: 100 µg/mL treatment at various concentrations for 24 hours.