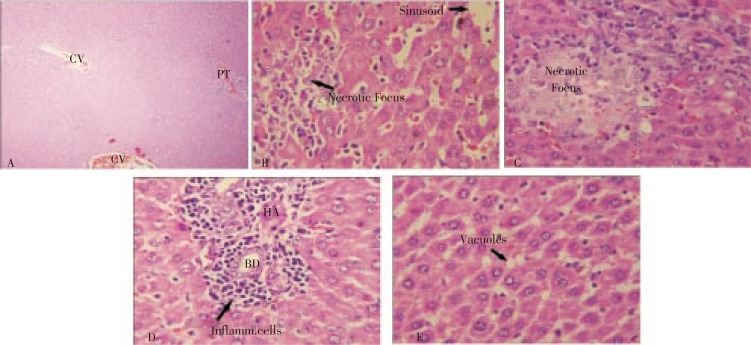
Figure 1. Histopathology of liver tissues.
(A) Liver from control group rat (CV=central vein, PT=portal triad). (B) Liver from animal treated with CCl4 only. (C) Liver from animal treated with CCl4 and 100 mg/(kg.d) of Silymarin. (D) Liver from animal treated with CCl4 and 100 mg/(kg.d) of aqueous extract of P. officinalis. (E) Liver from animal treated with CCl4 and 200 mg/(kg.d) of aqueous extract of P. officinalis.

