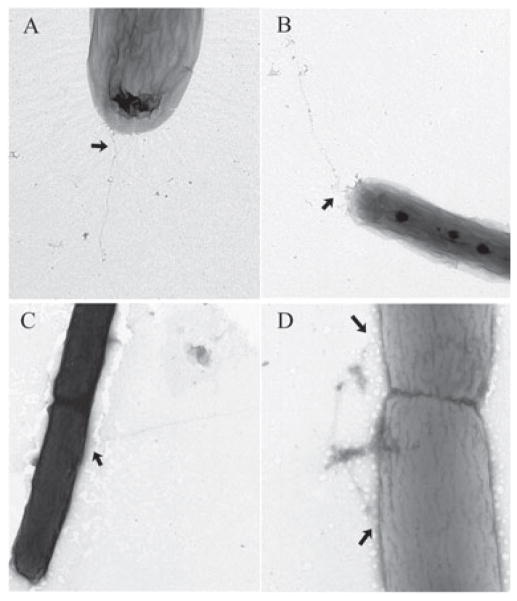
Fig. 7.
Visualization of tfp by electron microscopy. PA103 pUCP (panels A and B) and ΔfimX pFimXΔREC (panels C and D) bacteria were grown in LB supplemented with carbenicillin to OD600 = 0.6, then gently diluted 20- to 50-fold in ddH2O prior to preparation and staining of grids, as detailed in Experimental procedures. Images were obtained with a Technai 12 Biotwin at magnifications between 13 000x and 30 000x. Negatives were scanned at 1200 dpi, then cropped, assembled and labelled using Photoshop 7.0. Arrows indicate locations at which pili emerge from the cell body.

