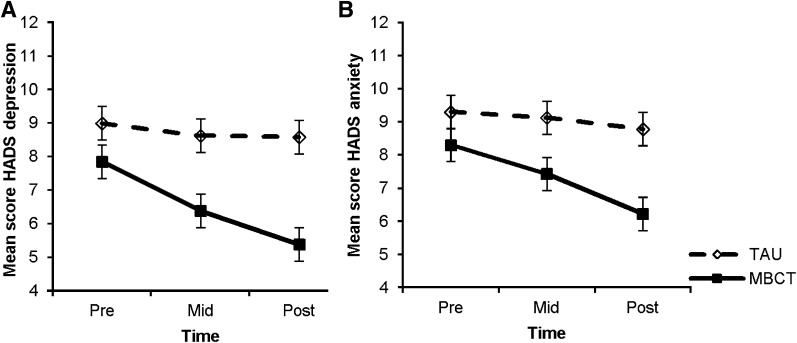
Figure 2.
A: Effect of MBCT on depressive symptoms. Data are presented as means and SE for MBCT (solid line) and TAU (dashed line) groups. Results of mixed-models analyses: P < 0.01, Cohen d = 0.52. B: Effect of MBCT on anxiety symptoms. Data are presented as means and SE for MBCT (solid line) and TAU (dashed line) groups. Results of mixed-models analyses: P = 0.02, Cohen d = 0.44.

