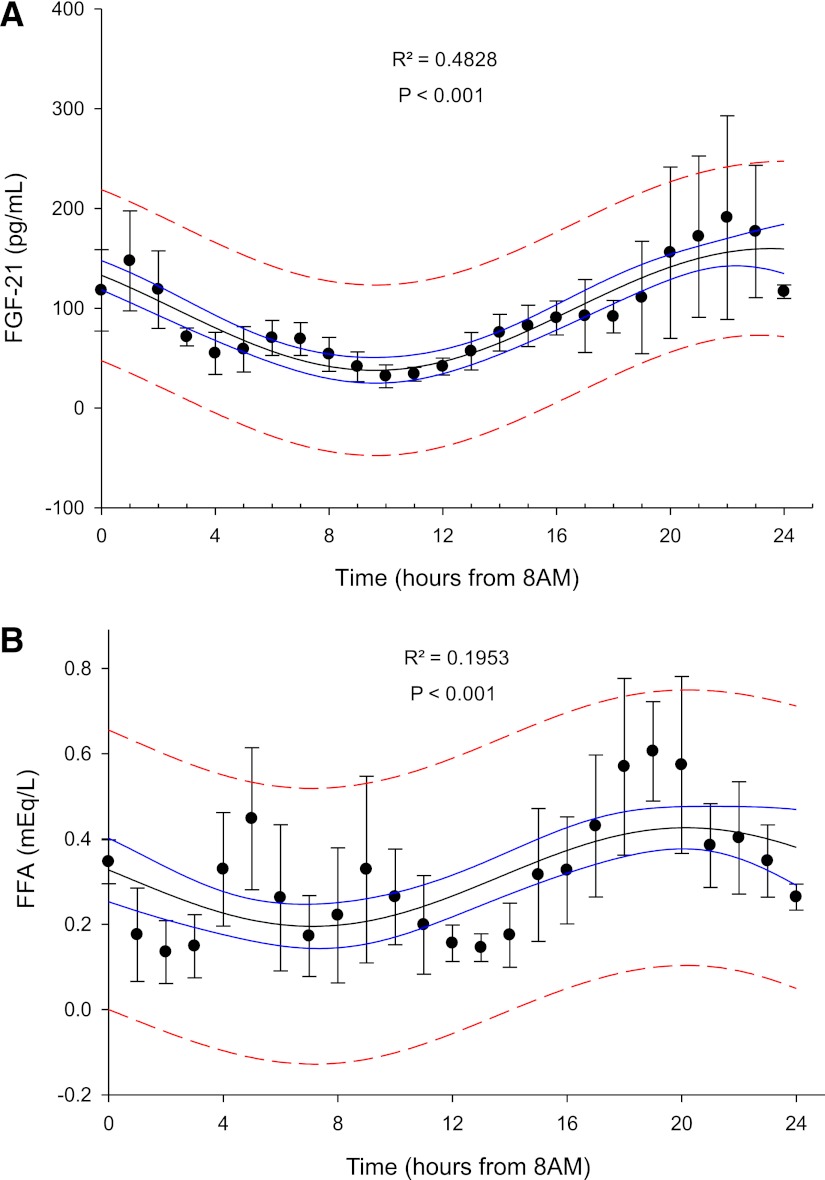
Figure 1.
A: Day–night variation of mean FGF-21 levels (pg/mL) in the fed state. Adjusted coefficient of determination (R2) is displayed at the top center. Solid line represents 95% confidence interval and interrupted line represents 95% prediction interval (n = 6). B: Day–night variation of mean FFA (mEq/L) levels in the fed state. Adjusted coefficient of determination (R2) is displayed at the top center. Solid line represents 95% confidence interval and interrupted line represents 95% prediction interval (n = 6). (A high-quality color representation of this figure is available in the online issue.)

