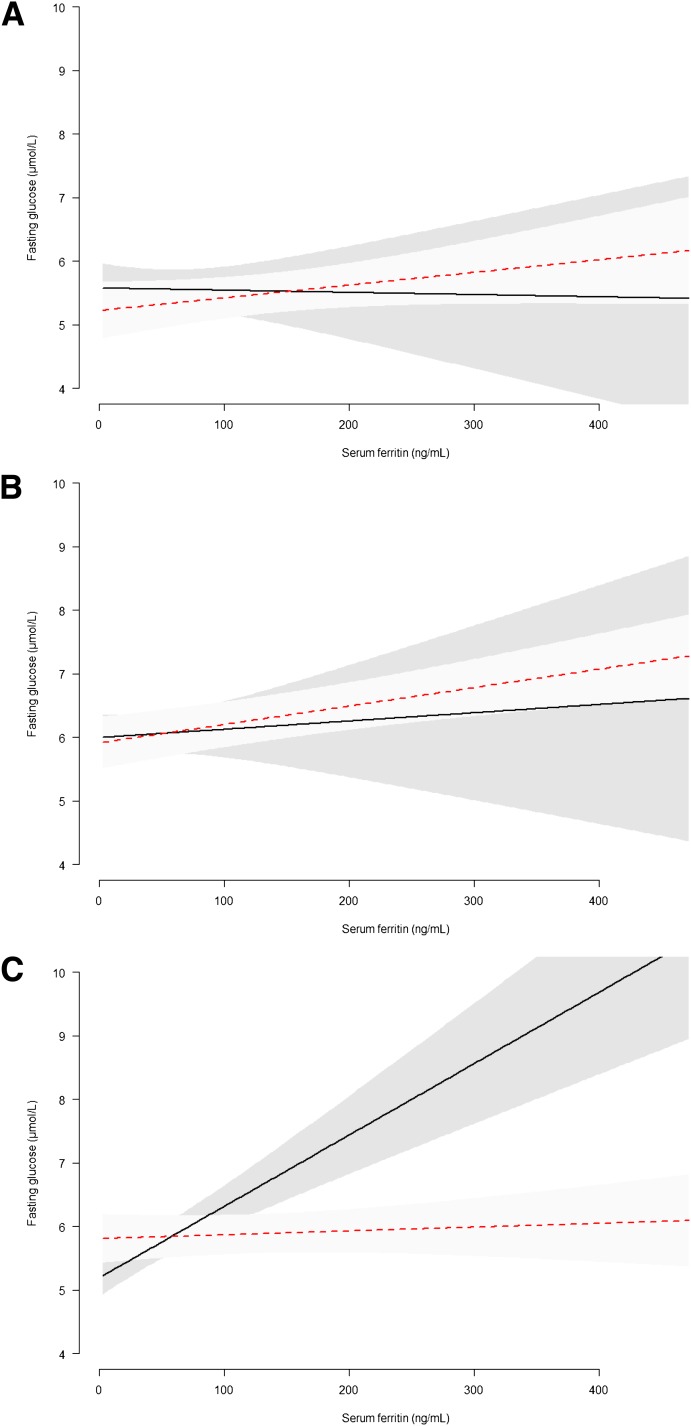
Figure 1.
Sex differences across ethnic groups (A, ethnic Dutch; B, South Asian Surinamese; and C, African Surinamese) in the association of serum ferritin and fasting glucose. Linear regression of model II: age, sex, ethnicity, a second-order interaction term (sex/ferritin/ethnicity), BMI, family history of diabetes, physical activity, smoking, alcohol use, and waist circumference. Dotted line, males; straight line, females. (A high-quality color representation of this figure is available in the online issue.)

