
Figure 1.
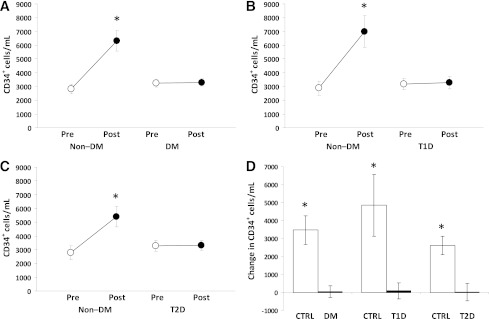
CD34+ cell mobilization after hrG-CSF. A: Absolute pre-G-CSF and post-G-CSF CD34+ cell count in all DM and all non–DM control (Ctrl) subjects (study primary end point). *P < 0.05 vs. baseline. Absolute pre-G-CSF and post-G-CSF CD34+ cell count in type 1 DM (T1D) compared with young control subjects (B) and in type 2 DM (T2D) compared with age-matched control subjects (C). *P < 0.05 vs. baseline. D: Changes in the absolute levels of circulating CD34+ cell counts. *P < 0.05 vs. DM.