Figure 2.

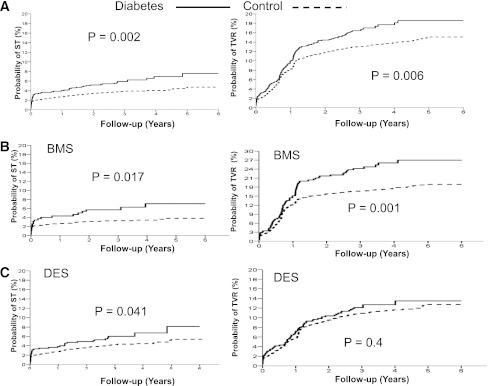
Kaplan-Meier survival curves show the impact of diabetes on event-free survival from stent thrombosis (ST; left graphs) and TVR (right graphs) in the overall population (A), in patients with BMS (B), and in patients with DES (C).

Kaplan-Meier survival curves show the impact of diabetes on event-free survival from stent thrombosis (ST; left graphs) and TVR (right graphs) in the overall population (A), in patients with BMS (B), and in patients with DES (C).