
FIG. 4.
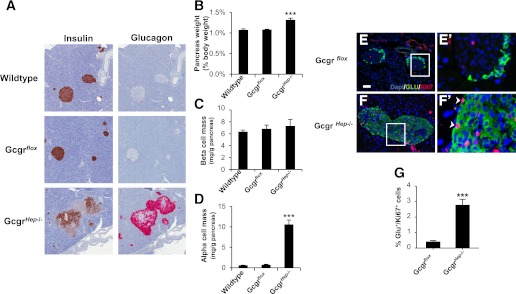
Ablation of the Gcgr in hepatocytes results in increased pancreas weight and α-cell hyperplasia. A: Representative histological sections stained for insulin (left panels) or glucagon (right panels). B: Pancreas weight of 20-week-old GcgrHep−/− males and littermate controls corrected for body weight (n = 8–10 mice). Pancreatic β-cell mass (C) and α-cell mass (D) per gram of pancreas. Data are mean ± SEM. ***P < 0.001 vs. wild type. Representative immunofluorescent sections stained for dapi (blue), glucagon (green), and Ki67 (red) from 22-week-old GcgrHep−/− mice (F) and littermate controls (E). E′ and F′: Higher magnification of sections containing Ki67-positive nuclei, denoted by white arrows, in α-cells. Insets are magnifications of selected Ki67-positive nuclei of α-cells (white box). White scale bar represents 50 μm. G: The α-cell proliferation rate (percentage of glucagon+/Ki67+ cells per total glucagon+ cells, n = 4 per group; 3 depths/pancreas). Data are mean ± SEM. ***P < 0.001 vs. Gcgrflox.