
FIG. 6.
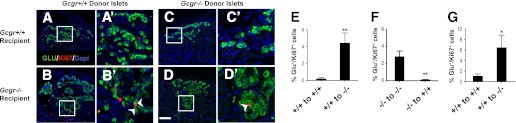
Gcgr+/+ islets transplanted into Gcgr−/− recipients exhibit increased α-cell proliferation. Islet graft sections from Gcgr+/+ (donor) to Gcgr+/+ (recipient; A) and Gcgr+/+ (donor) to Gcgr−/− (recipient; B) mice stained for Ki67 (red), glucagon (green), and dapi (blue). A′ and B′: Insets of A and B (white box from A, B). White arrows indicate Ki67-positive α-cells. Islet graft sections from Gcgr−/− (donor) to Gcgr+/+ (recipient; C) and Gcgr−/− (donor) to Gcgr−/− (recipient; D) mice stained for Ki67 (red), glucagon (green), and dapi (blue). C′ and D′: Insets of C and D (white box from C, D). White arrows indicate Ki67-positive α-cells. White scale bar represents 50 μm. Proliferation rate of α-cells in grafts of islets from 14-week-old Gcgr+/+ (E) or Gcgr−/− (F) mice (donors) transplanted beneath the right and left kidney capsule, respectively, of 14-week-old Gcgr+/+ (recipient) or Gcgr−/− (recipient) mice. The kidneys containing the islet graft were removed for analysis 8 weeks later (n = 3/mice, 3 sections/islet graft). Data are mean ± SEM. **P < 0.01 vs. control grafts (donor and recipient of same genotype). G: Proliferation rate of α-cells in grafts of islets from 14-week-old Gcgr+/+ mice transplanted beneath the right and left kidney capsule of 14-week-old Gcgr+/+ or Gcgr−/− mice. The kidney containing the islet graft was removed for analysis 1 week later (n = 4–6/mice, 3 sections/graft). Data are mean ± SEM. *P < 0.05 vs. Gcgr+/+ recipient grafts.