FIG. 1.
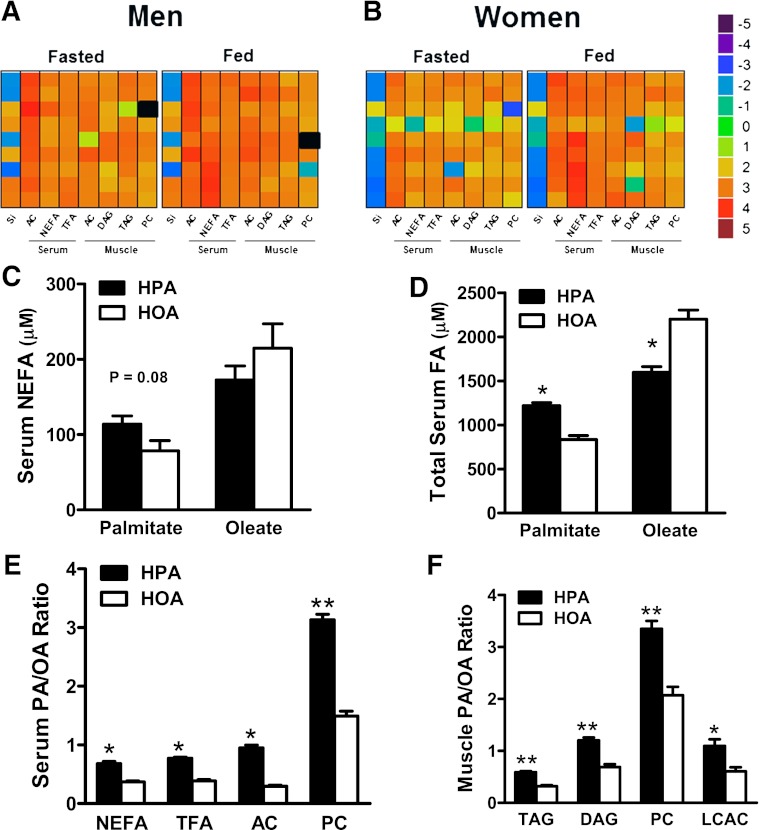
The FA composition of the diet is reflected in a broad range of circulating and intramuscular lipids (see text for abbreviations, except where indicated). A and B: Heat maps depicting diet-induced changes in the PA/OA ratio of blood and muscle lipids according to the scale on the right (total FA [TFA]). Change scores were calculated from absolute values of log base 5 transformed PA/OA data in the fasted or fed state on the HPA versus HOA diet (HPA/HOA). Each square represents an individual subject, and black indicates a missing value. SI reflects insulin sensitivity measured in the fasted state. Results in men and women were combined to show diet effects on serum concentrations (μmol/L) of nonesterified PA and OA (C); serum concentration (μmol/L) of total PA and OA (D); the PA/OA ratio in serum NEFA, TFA, AC, and PC (E); and the PA/OA ratio in skeletal muscle lipid metabolites (F): TAG, DAG, PC, and LCAC. *P ≤ 0.001, **P ≤ 0.01 denote diet effect.

