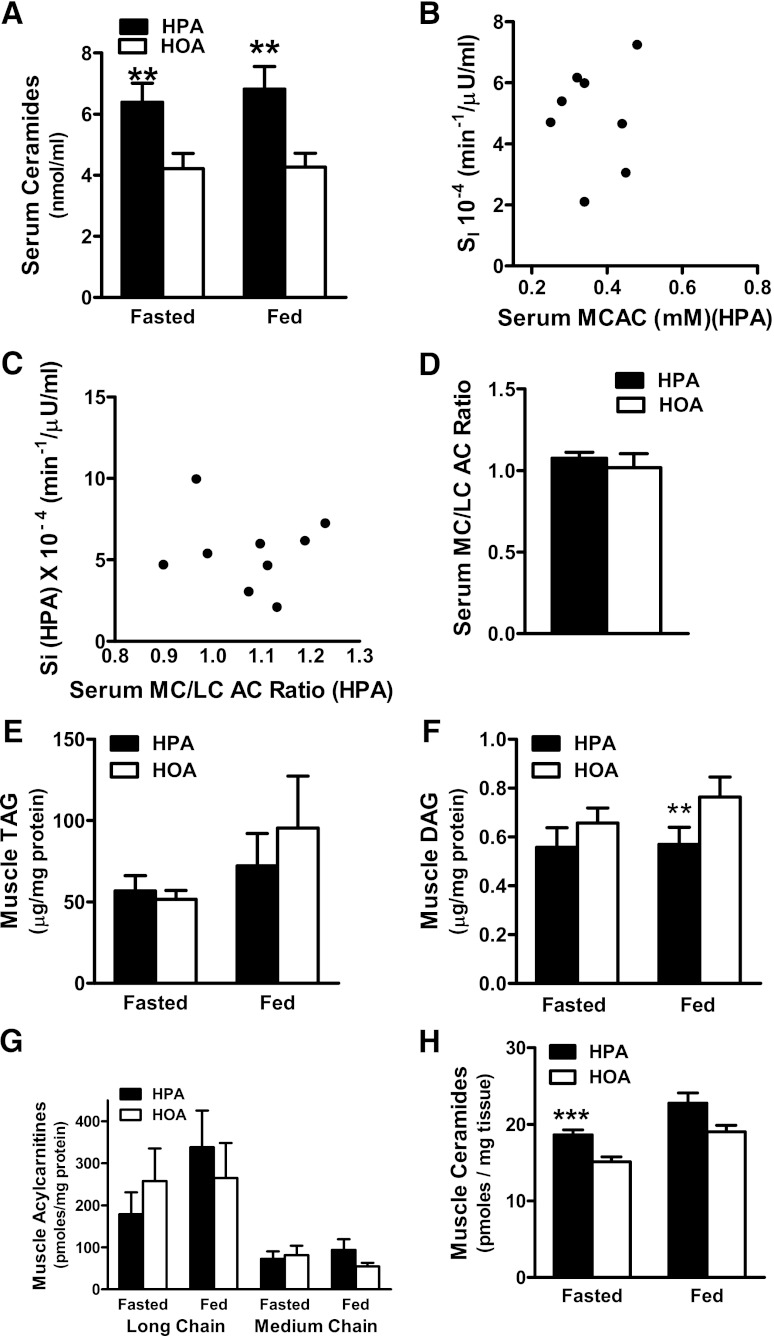
FIG. 4.
Dietary FA composition affected lipid biomarkers of insulin resistance in men. A: Serum ceramide concentrations measured in the fasting and fed states. B: Relationship between SI and MCAC measured in the fed state during the HPA diet (r = −0.33, P = 0.38). C: Relationship between SI and the serum MCAC/LCAC measured in the fed state during the HPA diet (r = 0.05, P = 0.90). D: Serum MCAC/LCAC ratio in the fed state. Muscle biopsy specimens harvested in the fasted and fed states were used to quantify intramuscular concentrations of TAG (E), DAG (F), and LCAC and MCAC (G) and total ceramides (H). **P ≤ 0.01, ***P ≤ 0.05 denote a diet effect.

