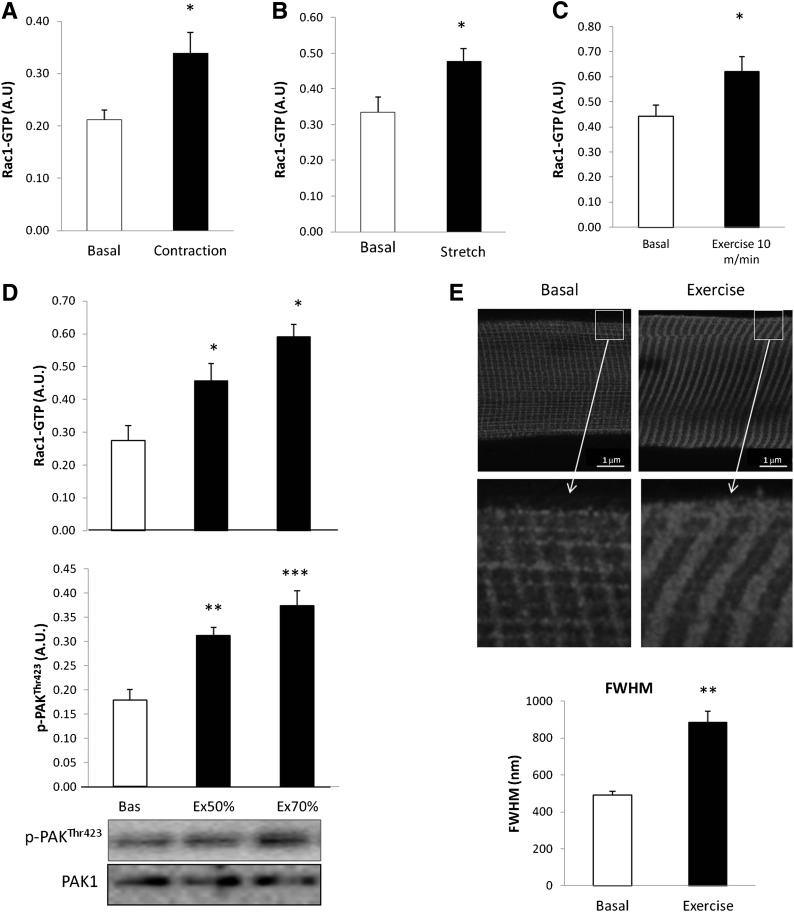
FIG. 2.
A: Rac1-GTP binding in incubated mouse soleus muscle stimulated with (black bar) or without (white bar) electrically induced contraction (100 Hz 15-s intervals, 2-s train, 0.2-ms impulses) (n = 7). B: Rac1-GTP binding in incubated mouse soleus muscle kept at resting tension (2–5 mN; basal) or stretched (150 mN, 15 min) (n = 7). C: Mouse quadriceps muscle, basal and after 30 min running at speed of 10 m/min (exercise 10 m/min = 40% of max running speed) (n = 7). D: Rac1-GTP binding (top) and p-PAKThr423 (middle), and representative blots (bottom) in mouse quadriceps muscle basal or in response to 30-min treadmill running at 50 or 70% (Ex 50/70%) of maximum running speed (n = 8). E: Representative images and bar graph (FWHM) showing Rac1 staining of single fibers isolated from mouse EDL muscle in the basal state or after 30 min of treadmill running at 70% of maximum running speed (n = 5). Statistical significance compared with basal is indicated by *P < 0.05; **P < 0.01; ***P < 0.001. Values represent mean ± SEM.

