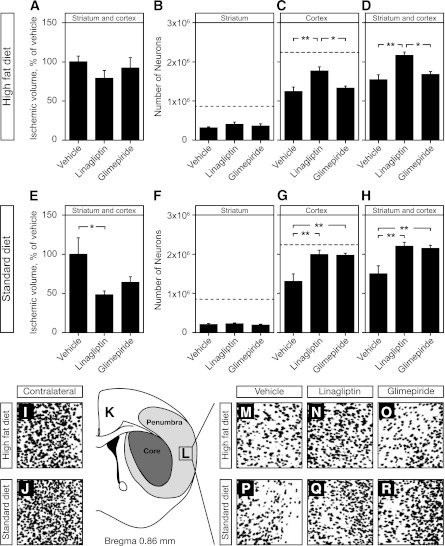
FIG. 4.
Neuroprotective effects of linagliptin and glimepiride treatments. A: Ischemic volume (mm3) after 30 min of MCAO in HFD-fed mice. Number of surviving neurons in stroke-damaged striatum (B), cortex (C), and striatum and cortex combined (D) in HFD-fed mice. E: Ischemic volume (mm3) after 30 min of MCAO in nondiabetic mice. Number of surviving neurons in stroke-damaged striatum (F), cortex (G), and striatum and cortex combined (H) in nondiabetic mice. The dashed lines in B, C, F, G, represent the average number of neurons in the brain areas of naïve animals (no stroke) where the neuronal quantification was performed. Bars represent means ± SEM. One-way ANOVA, followed by Bonferoni post hoc tests, was used. *P < 0.05, **P < 0.01. K: An illustration of typical brain damage in our stroke model. I and J: Photomicrographs of the area of the cortex illustrated in L on the contralateral, nondamaged, side of the brain, show normal neuronal density. Photomicrographs of the area (L) of the stroke-damaged cortex in HFD (M–O) and normal diet (P–R) illustrating the changes in neuronal density in vehicle, linagliptin, and glimepiride-treated mice, respectively. All photomicrographs have been enhanced with high-contrast monochromatic adjustment for better visual representation on small images.

