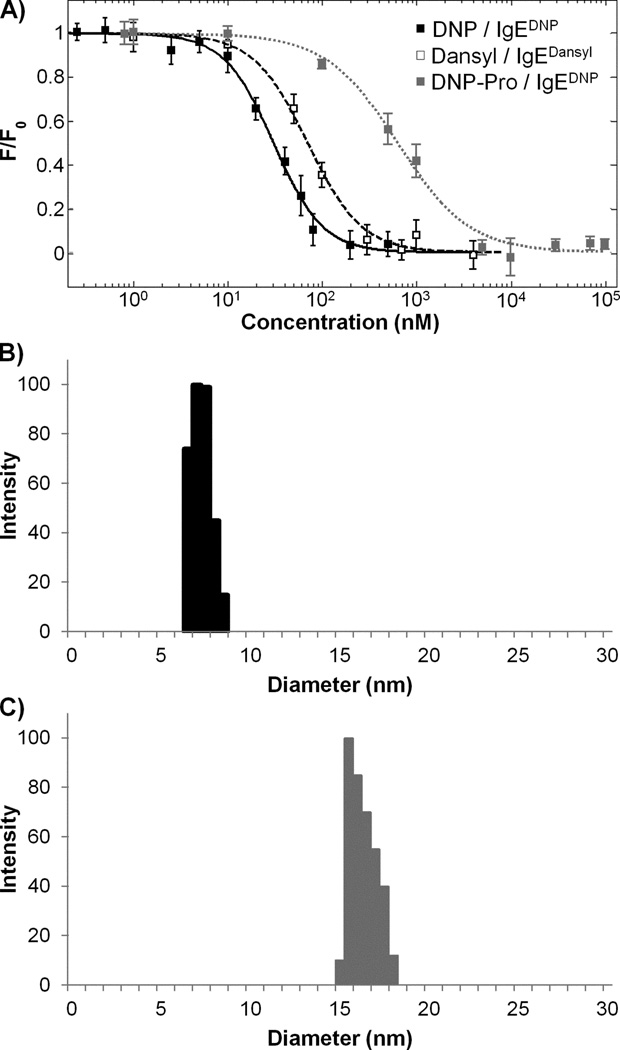
Figure 3. Characterization of the hapten/IgE binding interactions.
A) Binding curves for monovalent DNP/IgEDNP (■), monovalent DNP-Pro/IgEDNP ( ), and monovalent dansyl/IgEdansyl (□) interactions are shown. Binding was observed by monitoring the fluorescence quenching of tryptophan. Values for the binding constants are KdDNP = 22 ± 2 nM, KdDNP-Pro = 550 ± 40 nM and Kddansyl = 54 ± 4 nM. Control experiments done with DNP/IgEdansyl, DNP-Pro/IgEdansyl, or dansyl/IgEDNP did not show any cross-reactivity, Figure S1. Data represents means ± SD of triplicate experiments. B) DLS data demonstrates the aggregation of IgEDNP and IgEdansyl in response to addition of a stoichiometric concentration of HtTA. The size of the monomeric IgE antibodies was 7.5 nm and increased to 16 nm upon the addition of the HtTA.

