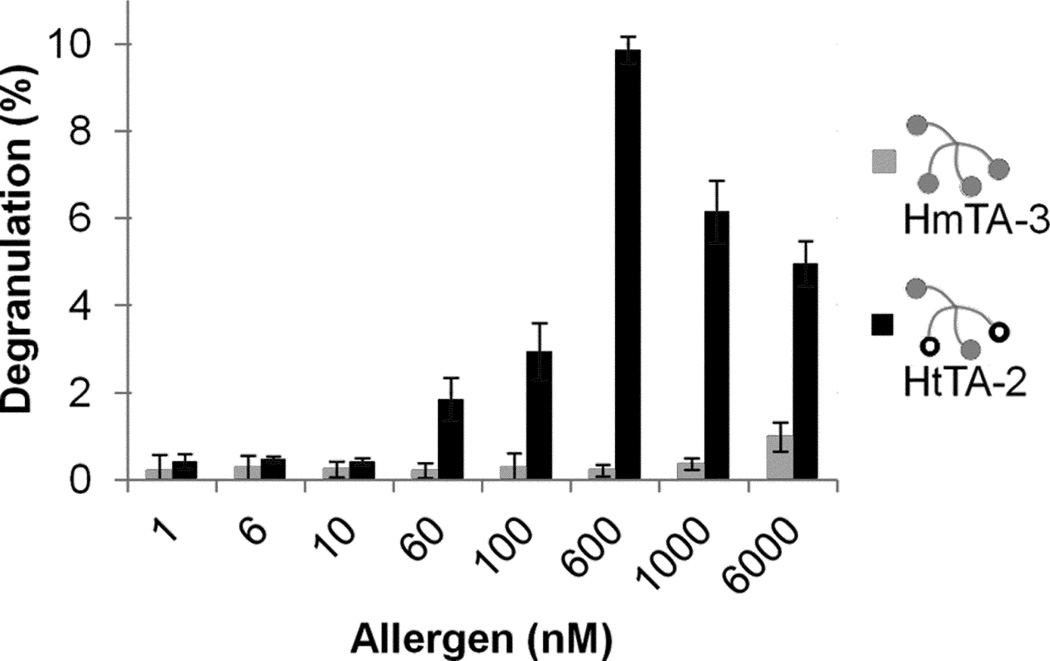
Figure 5. Mast cell degranulation response induced by low-affinity epitopes.
Degranulation response of RBL cells in response to increasing concentrations of HmTA-3 and HtTA-2. HmTA-3 was unable to stimulate a response at any concentration, while HtTA-2 was a potent stimulator with a maximum response observed at 600 nM. Triton X (1%) was used to determine the percent degranulation. Data represents means ± SD of triplicate experiments.

