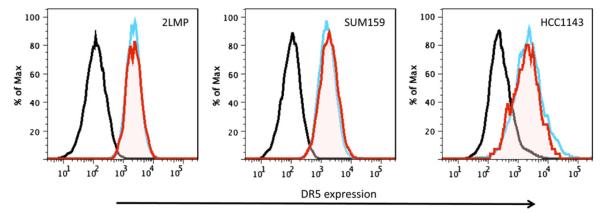
Fig. 1.

Flow cytometry analysis of DR5 membrane expression on the CD44+/CD24−/ALDH+ subpopulation of basal-like breast cancer cells. 2LMP, SUM159, and HCC1143 cells were labeled with ALDEFLUOR (FITC), CD44 (PE, Cy7), CD24 (PE), and anti-DR5 (TRA-8 Alexa-647) then analyzed by flow cytometry. DR5 membrane expression on total unsorted bulk population (blue line) or CD44+/CD24−/ALDH+ (red line) subpopulation compared with isotype control (black line). 2LMP, SUM159, and HCC1143 CD44+/CD24−/ALDH+ subpopulations had similar DR5 expression compared with the total unsorted cell population
