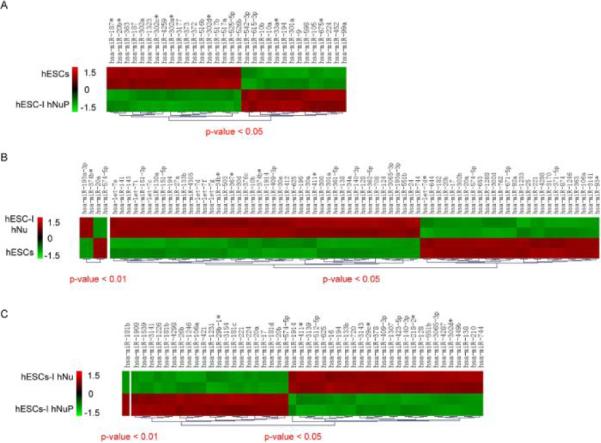
Figure 3. Comparing miRNA differential expression patterns in pluripotent hESCs, hESC-I hNuPs, and hESC-I hNus.

(A) Hierarchal clustering of differentially expressed miRNAs in pluripotent hESCs and hESC-I hNuPs. (B) Hierarchal clustering of differentially expressed miRNAs in pluripotent hESCs and hESC-I hNus. (C) Hierarchal clustering of differentially expressed miRNAs in hESC-I hNuPs and hESC-I hNus. Statistically significant p values and clustering analysis were provided by LC Sciences as part of miRNA microarray service. Microarray data from two biological replicate sets were shown. The numbers for the color bar are Z values, showing the extents of down-regulation (green, −1.5) or up-regulation (red, 1.5) of the expression.
