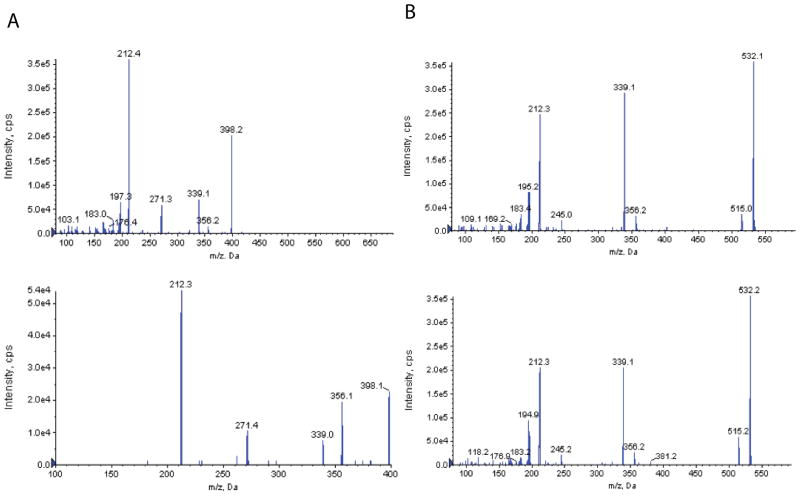
Figure 2.
Identification of Ac-T1AM (A) and T1AM-glucuronide in mouse serum 10 minutes post-T1AM injection. A) The EPI spectrum of the +42 metabolite identified in serum (top panel) and the MS/MS spectrum of synthetic N-acetyl-T1AM (bottom panel). B) The EPI spectrum of the +176 metabolite identified in serum (top panel) and the EPI spectrum generated for enzymatically synthesized T1AM-glucuronide (bottom panel) with the chemical structure inset.

