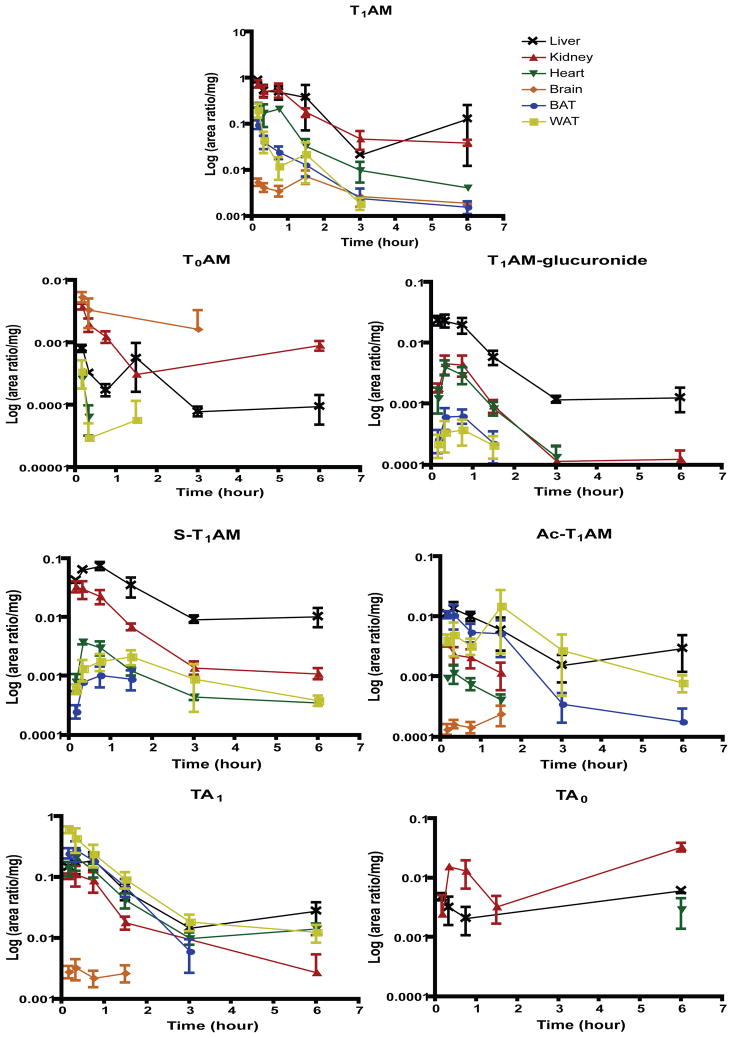
Figure 6.
Relative tissue distribution of T1AM metabolites to liver, kidney, heart, brain, BAT and WAT. Peak areas were integrated with respect to the deuterated internal standard (d4-T1AM used for T1AM-glucuronide, S-T1AM and Ac-T1AM) and the area ratio was normalized to the amount of tissue analyzed; n = 1–3 per point. T0AM was not detectable in BAT. TA0 was not detected in brain, BAT or WAT, and was only detected in heart at 6 hours (n = 2).

