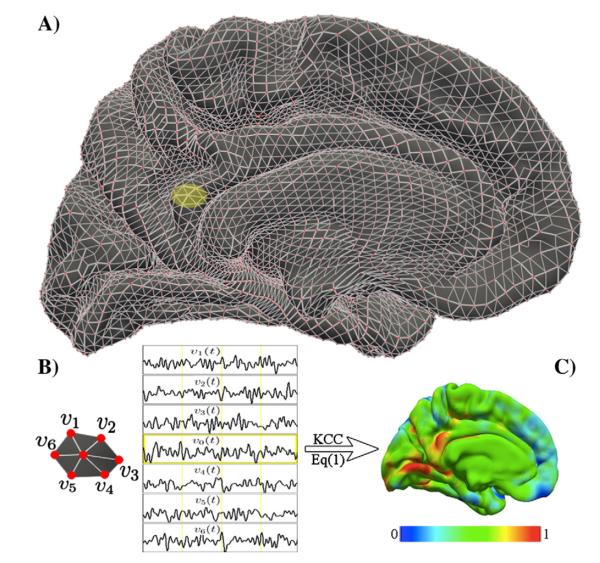
Fig. 1. KCC-ReHo computation on the cortical surface: 2dReHo.
The geometry of the cortical surface (e.g., here the medial cortical surface of the left hemisphere) is illustrated in (A). The preprocessed R-fMRI data are projected onto vertices of the cortical surface. For a given vertex v0, its nearest neighbors are v1, v2, v3, v4, v5, and v6, which are indicated as the yellow patch (A) and are zoomed in (B). Based on R-fMRI time series from all the 7 vertices denoted by vi(t), the Kendall’s coefficient of concordance (KCC) of the vertex v0 is calculated. Such computation is repeated for all vertices in the surface to produce individual vertex-wise KCC-ReHo surface maps (C). The colormap indicates the KCC values.

