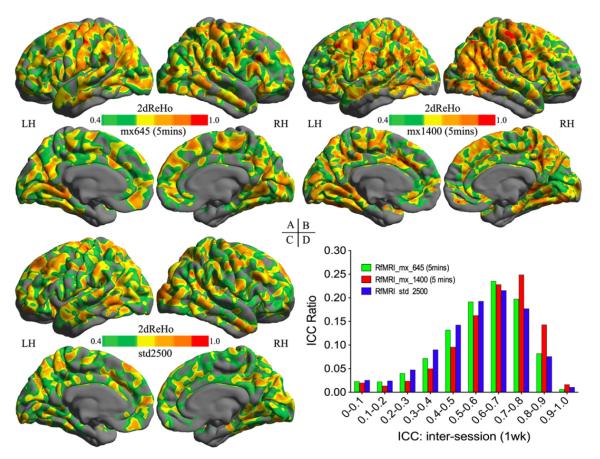
Fig. 6. Influence of imaging resolution on test–retest reliability of 2dReHo.
The inter-session (one week apart) ICC maps of 2dReHo derived from mx_645 5-min (A), mx_1400 5-min (B), and std_2500 5-min (C) R-fMRI test–retest data. Only brain regions demonstrating at least moderate ICC (≥0.4) are colored. The colormap indicates ICC values. To access the influence of imaging sequences on the ICC distribution, the histogram of ICC values are plotted for these three ICC maps (D).

