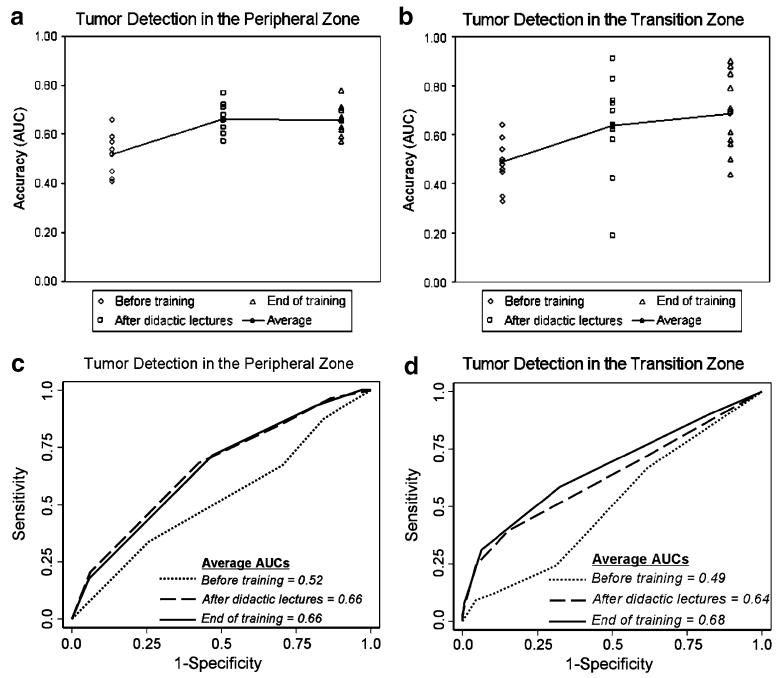
Fig. 2.
Scatterplots (a, b) and ROC curves (c, d) summarize the radiology fellows’ individual and average accuracy levels in determining tumour location in the peripheral and transition zones of the prostate before training, after interactive didactic lectures and at the end of dedicated training. For the peripheral zone, the average AUC significantly increased from 0.52 (baseline before training) to 0.66 (after didactic lectures) and remained at 0.66 (end of training) (p<0.0001 for both) (c). For the transition zone, the average AUC significantly increased from 0.49 (baseline before training) to 0.64 after didactic lectures (p=0.01 vs. baseline) and to 0.68 (end of training) (p=0.001 vs. baseline) (d)

