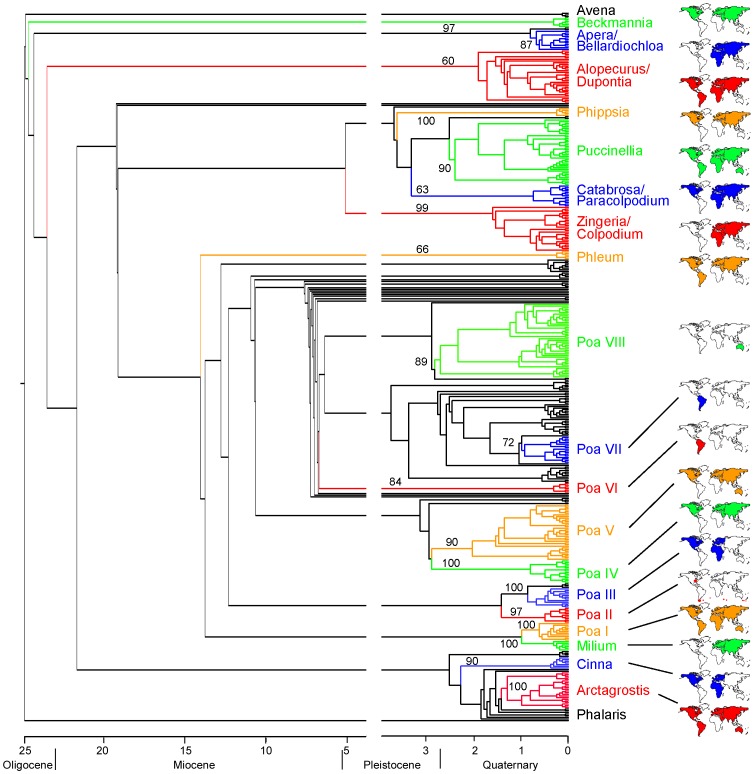
Figure 1. Simplified phylogram from maximum likelihood analysis of ribosomal ITS sequences in Poa and related genera.
Bootstrap support for the major clades are indicated at the branches. Informal names of the clades are given in conjunction with their distribution. For taxon names see the phylogenetic tree in the figure S1.

