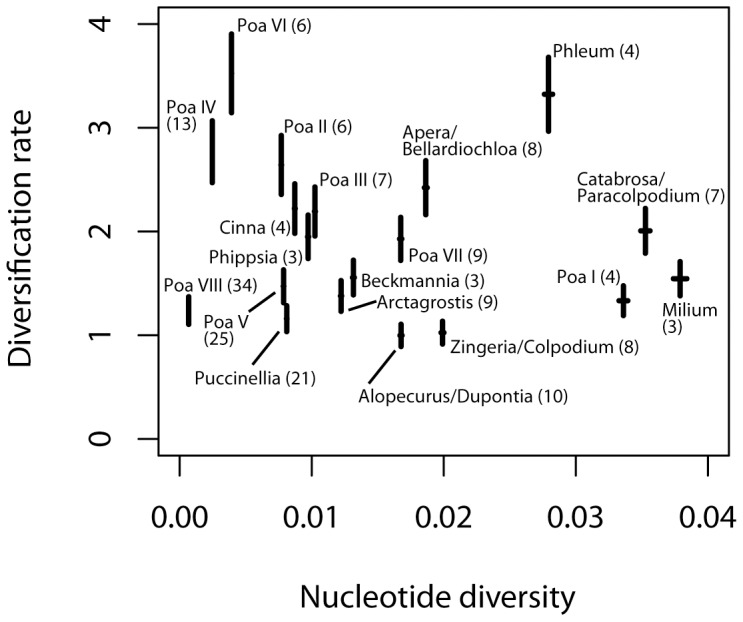
Figure 2. Diversification rates and nucleotide diversity.

Estimates of the diversification rates of the clades (figure 1) under the assumption that all taxa of the clades were included in the analysis. The span of the vertical bars refers to the two dates (20 and 25 Myr, respectively) used for calculation of the absolute ages. The lower end represents the diversification rate for the dating with 25 Myr, the upper for 20 Myr. The x-axis indicates Nei's nucleotide diversity of the clades (the numbers in brackets refer to the number of DNA sequences used for its calculation). The variance is indicated as horizontal bars. There is no significant correlation between diversification rate and the nucleotide diversity.
