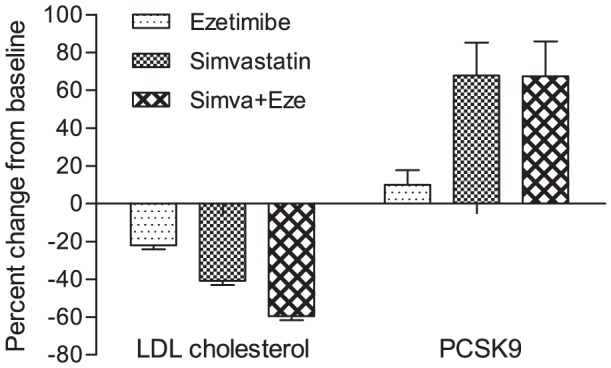
Figure 2. Change in LDL cholesterol and PCSK9 from baseline according to treatment groups.

Data are means ± SEM. The decrease in LDL cholesterol was significant in all groups (all P<0.0001), the increase in PCSK9 was significant in the simvastatin and in the combination groups (P<0.005), but not in the ezetimibe group.
