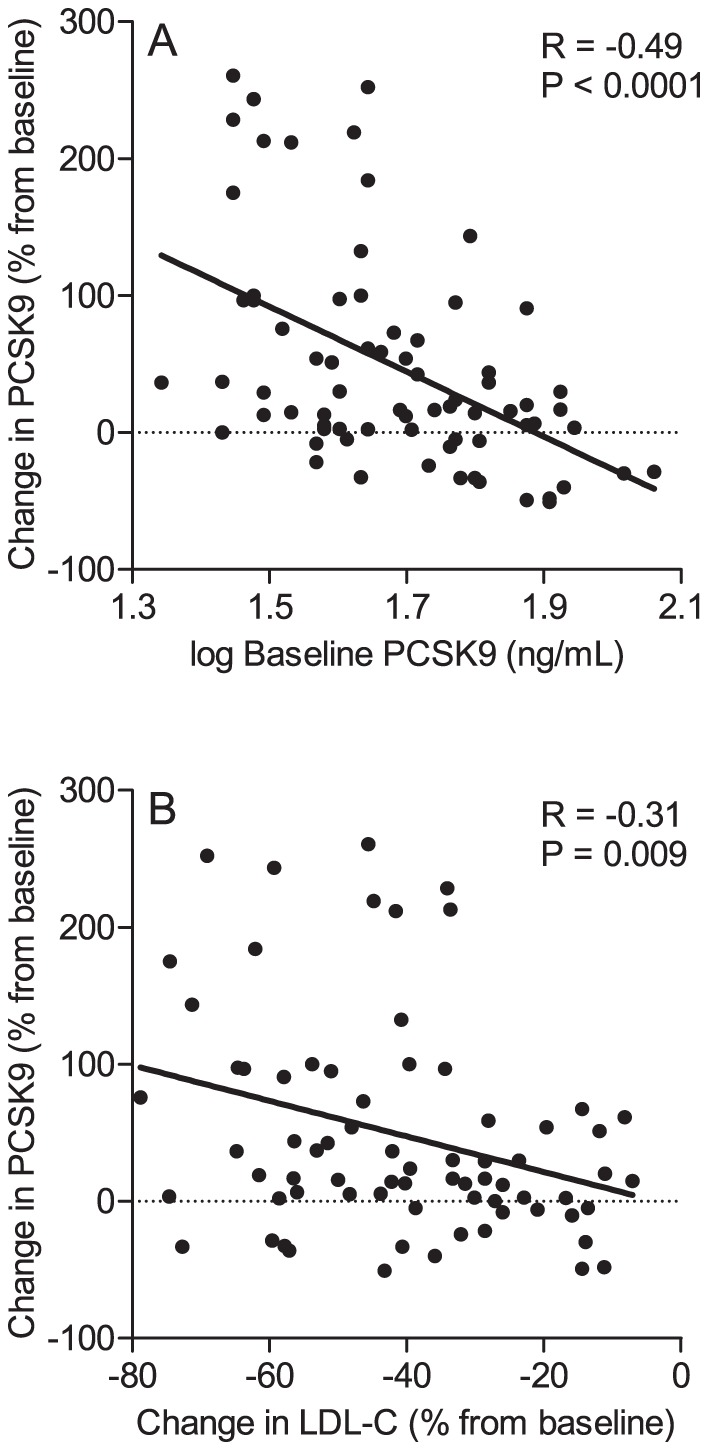
Figure 3. Change in PCSK9 from baseline according to baseline PCSK9 and baseline LDL cholesterol.

(A) Correlation between baseline PCSK9 concentrations (log-transformed) and percent change in PCSK9 from baseline in the total cohort (N = 72). (B) Correlation between percent change in LDL cholesterol and percent change in PCSK9 from baseline in the total cohort (N = 72). The R values shown are the ones from linear regression analyses. The corresponding R values from Spearman’s rank correlation analyses are –0.47 (P<0.0001) or –0.30 (P<0.001), respectively.
