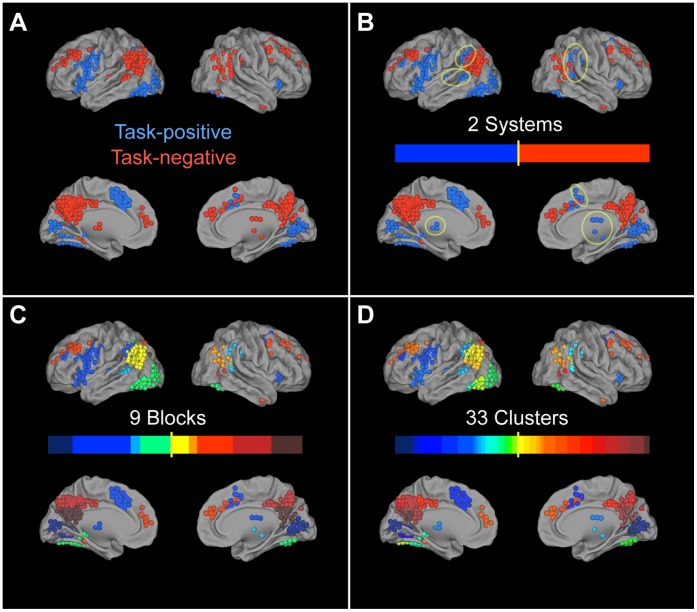
Figure 3. Brain maps of hierarchical partitioning.
(A) Task-positive and task-negative regions defined through univariate GLM methods have high correspondence with (B) the 2 systems found through modularity-based partitioning, with the exception of a few subcortical,fronto-parietal, and temporal areas (highlighted by yellow circles). Brain maps of (C) the 9 blocks and (D) the 33 clusters show that functional groups tend to be spatially localized and confined to only a few anatomical regions.

