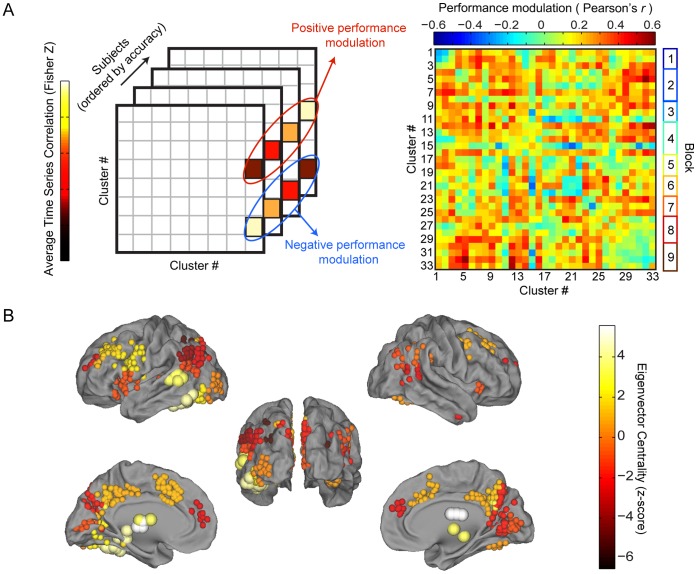
Figure 6. Performance modulation network quantifies modulation of correlations by task accuracy and reveals key hub regions.
(A) We investigated the hub-like nature of the 33 clusters by averaging together link weights of all links within clusters as well as links between pairs of clusters to create cluster-level connectivity matrices for all subjects. Performance modulation for every link was then found by calculating the correlation of link weight with task accuracy across participants to create the performance modulation matrix. (B) We classify as hubs the clusters with the highest eigenvector centrality values calculated on the performance modulation matrix from (A). The hubs found (large spheres) encompass key reading areas such as fusiform gyrus and left temporal gyrus, as well as dorsal striatum, thalamus, and left hippocampus. Views depicted are lateral (top), posterior (center), and medial (bottom).

