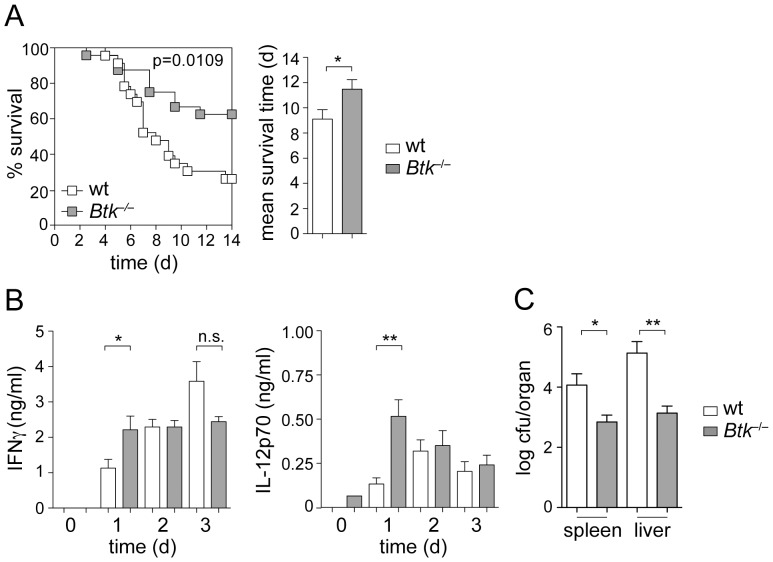
Figure 6. Btk-deficient mice show reduced susceptibility to Lm infection.
(A) Left panel: Kaplan-Meier plot showing the survival of wt and Btk −/− mice after Lm (EGD, 106 CFU) infection over a period of 14 days. Right panel: Diagram indicates the mean survival time of wt and Btk −/− mice after Lm infection. Data show the summary of two independent experiments with a total of 23 wt and 24 Btk −/− mice. (B) Wt and Btk −/− mice were infected with Lm (EGD, 106 CFU) and serum IFN-γ (left) and IL-12p70 (right) levels were measured on day 1, 2 and 3. n = 5 (day 1), 6 (day 2), 5 (day 3) for IFN-γ and 5 (day 1), 5 (day 2), 5 (day 3) for IL-12p70. (C) Wt and Btk −/− mice were infected with Lm (EGD, 106 CFU) and CFU-spleen and CFU-liver were measured on day 5. n = 5 (wt) and 8 (Btk-null). (A–C) Mean with SEM is shown. Survival data were analyzed using a log rank (Mantel-Cox) test, while the other P-values were calculated using an unpaired Student's t-test. *, P≤0.05; **, P≤0.01; n.s. not significant.

