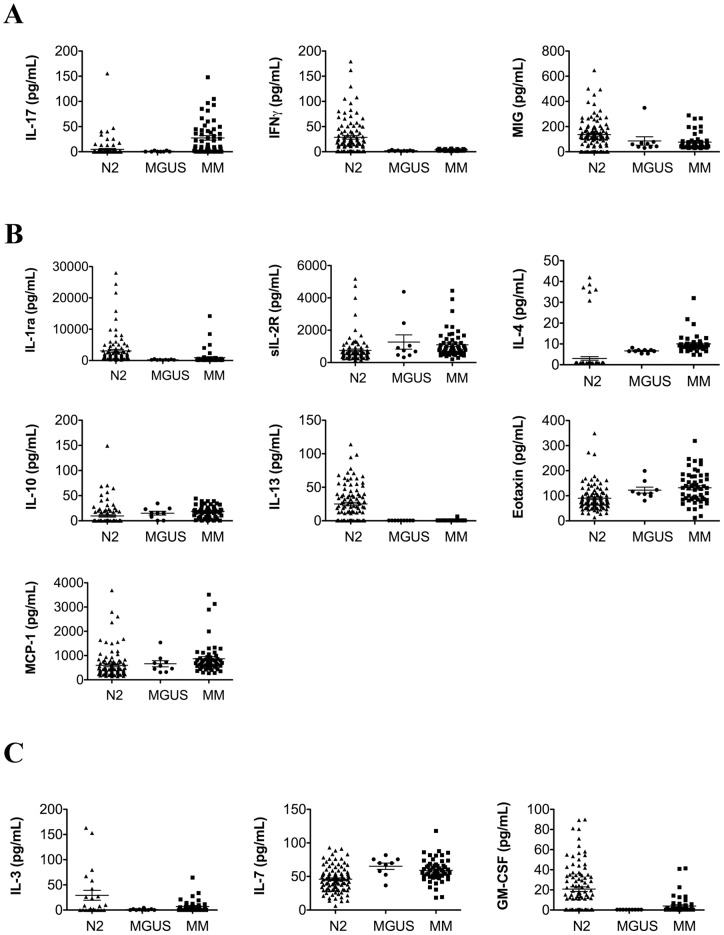
Figure 3. Patients with multiple myeloma present with a systemic cytokine profile consistent with an anti-inflammatory environment.
Differential expression of cytokines between N2, MGUS, and MM populations (fold change >1.25 with p-values <0.05; exact values for all fold-changes and p-values are in Table 3). MGUS* denotes those cytokines with significant differences in expression between MGUS and MM; MGUS** denotes those cytokines with significant differences in expression between MGUS and N2; (A) pro-inflammatory cytokines (B) anti-inflammatory cytokines, (C) lymphocyte growth factors.

