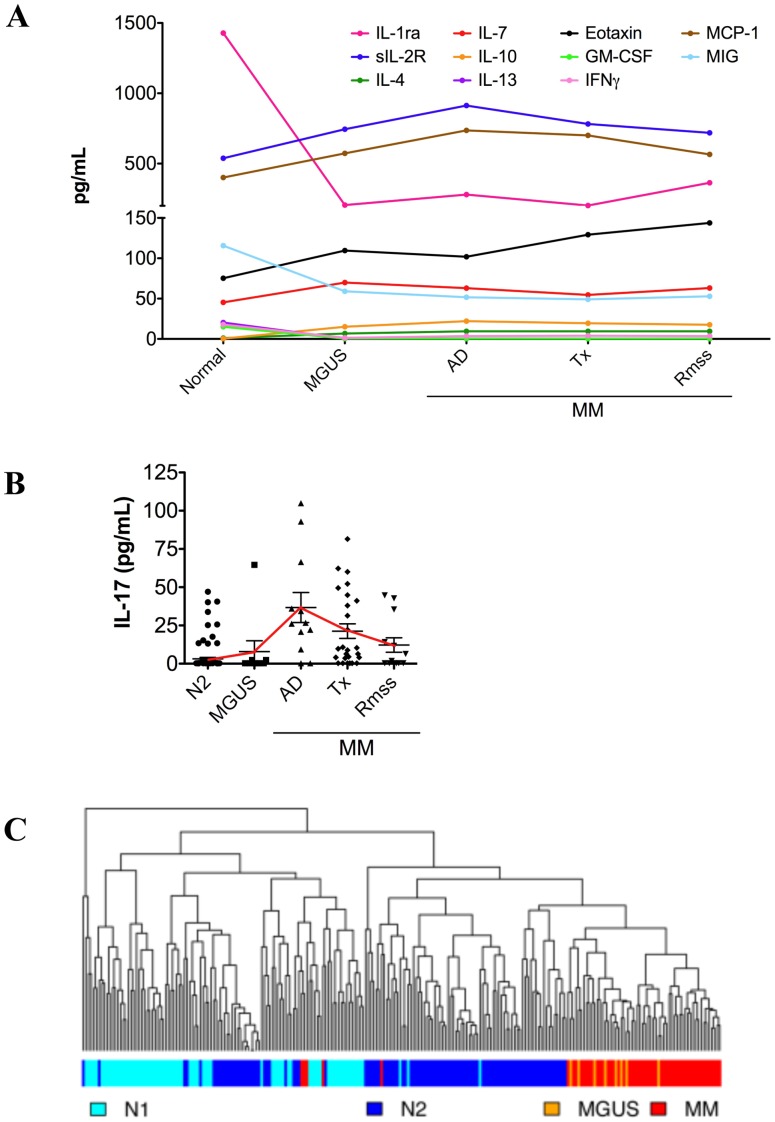
Figure 4. Cytokine profile of patients entering remission from multiple myeloma is not restored to homeostasis.
(A) Levels of cytokines differentially expressed between N2 and MM were evaluated as a function of the disease stage (i.e. active disease (AD), treatment (Tx), and remission (Rmss)). Median expression values for each cytokine are plotted. All cytokines levels were statistically different (p<0.01) between N2 and MM, but not between the stages of MM (p>0.05). With the exception of sIL-2R, MCP-1, and MIG, all cytokines were differentially expressed between N2 and MGUS (<0.03). (B) Expression of IL-17, the only cytokine expression of which is restored after treatment, for each stage of MM. The solid line denotes the trend of IL-17 expression over the course of the disease. Statistical significance: N2 vs. MGUS, p>0.05; N2 vs. active disease, p<0.0001; N2 vs. treatment, p<0.0001; N2 vs. remission, p>0.05. (C) Dendogram depicting the results of hierarchical clustering of all plasma donors based on their placement into N1, N2, MGUS, and MM cohorts. The colored bar shows the placement of each donor within the study populations (N1, light blue; N2, dark blue; MGUS, orange; MM, red).

