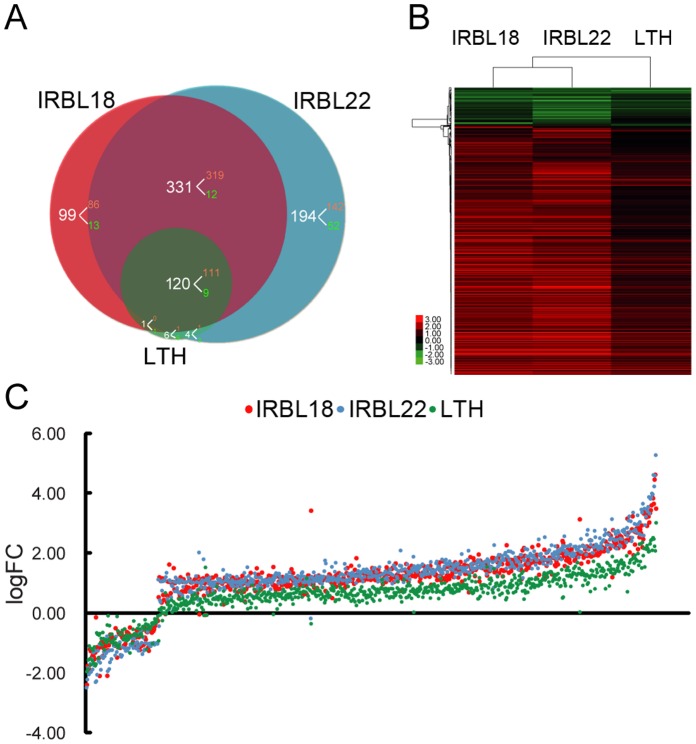
Figure 2. Differentially expressed genes (DEGs) identified from the transcriptome study.
A: The venn diagram of DEGs in IRBL18, IRBL22 and LTH. The numbers of up- and down-regulated genes were shown in red and green, respectively. B: Hierarchical clustering of the log2-transformed fold changes. The scale bar displays log2-transformed fold changes. C: Scatter plot of log2-transformed fold changes.

