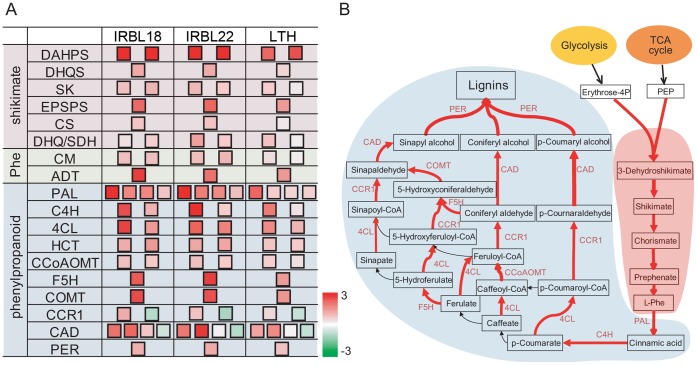
Figure 5. Transcriptional changes in shikimate and phenylpropanoid biosynthesis pathways.
A: The expression patterns of genes in the shikimate and phenylpropanoid biosynthesis pathway. The scale bar displays log2-transformed fold changes. B: The metabolic view of shikimate and phenylpropanoid biosynthesis pathways. The steps catalyzed by enzymes encoded by up-regulated genes were shown in red. The shikimate and phenylalanine biosynthesis pathways were highlighted with pink background and the phenylpropanoid biosynthesis pathway was highlighted with light blue background. Gene abbreviations were listed in Table S5.

