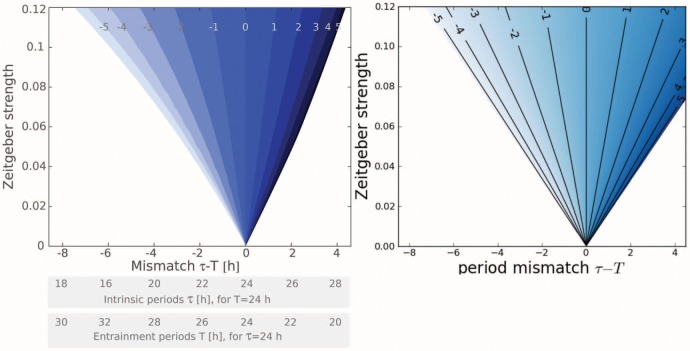
Figure 3. Phases of entrainment within the entrainment regions.
Left: Numerical simulations of amplitude-phase model. Right: Entrainment phases from Eq. (2) derived from the Kuramoto phase equation. In both cases the entrainment phase varies from −6 h to 6 h between the borderlines of entrainment. Note that the lines with  h are very close to those with
  h and are not marked separately for the sake of clarity of the graphical representation.

