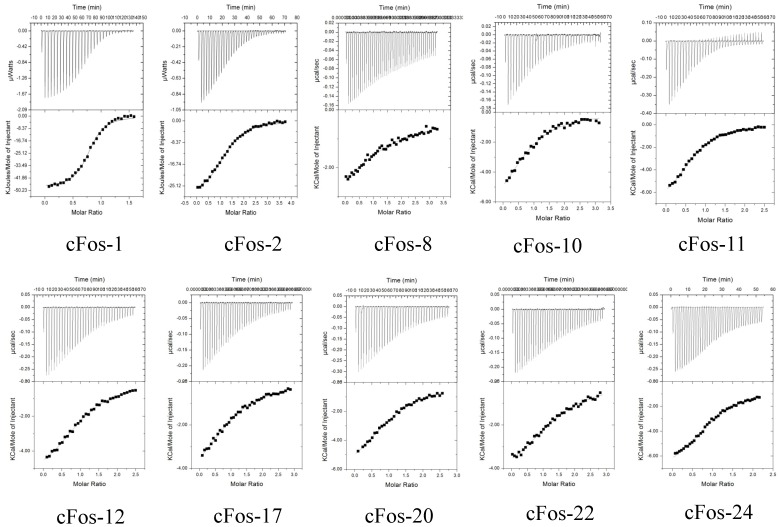
Figure 5. Isothermal Titration Calorimetry (ITC) analysis of leucine zipper domain interactions between constrained peptides and cFos.
Shown are isotherms for all ten measureable heterodimers (1, 2, 8, 10, 11, 12, 17, 20, 22, and 24) injected into a cell containinginto cFos. The top and bottom panels show, respectively, raw data after baseline correction. During ITC experiments, approximately 200–600 µM of peptide A was injected in 30–40×5 µl batches from the injection syringe into the cell, which contained 10–40 µM cFos. Both partners were in a 10 mM Potassium Phosphate buffer, 100 mM Potassium Fluoride at pH 7. Experiments were undertaken at 20°C. The solid lines represent the fit of the data to the function based on the binding of a ligand to a macromolecule using the Microcal (GE Healthcare) Origin software [57].

