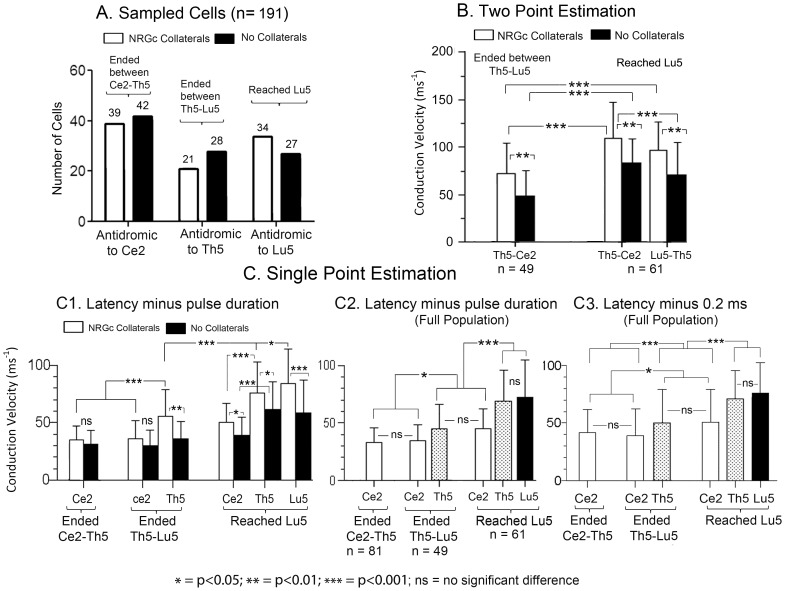
Figure 3. SRD spinally projecting fibers increased in antidromic conduction velocity with termination distance and NRGc collateralization.
A, sampled neurons with fibers collateralizing (white columns) or not (black columns) to or through the NRGc, and ending between Ce2-Th5, between Th5-Lu5 or Lu5. B, thoracic-cervical (Th5-Ce2) and lumbar-thoracic (Lu5-Th5) means ± SD antidromic conduction velocities estimated by two-point stimulation. C, means ± SD of antidromic conduction velocities estimated by single point stimulation subtracting pulse duration (C1; C2) or 0.2 ms (C3) to antidromic latency measurements. Abbreviations at the X axis signal the stimulation sites at each spinal segment. The P-values of the pairwise comparisons were calculated by the Dunn's post-test.

