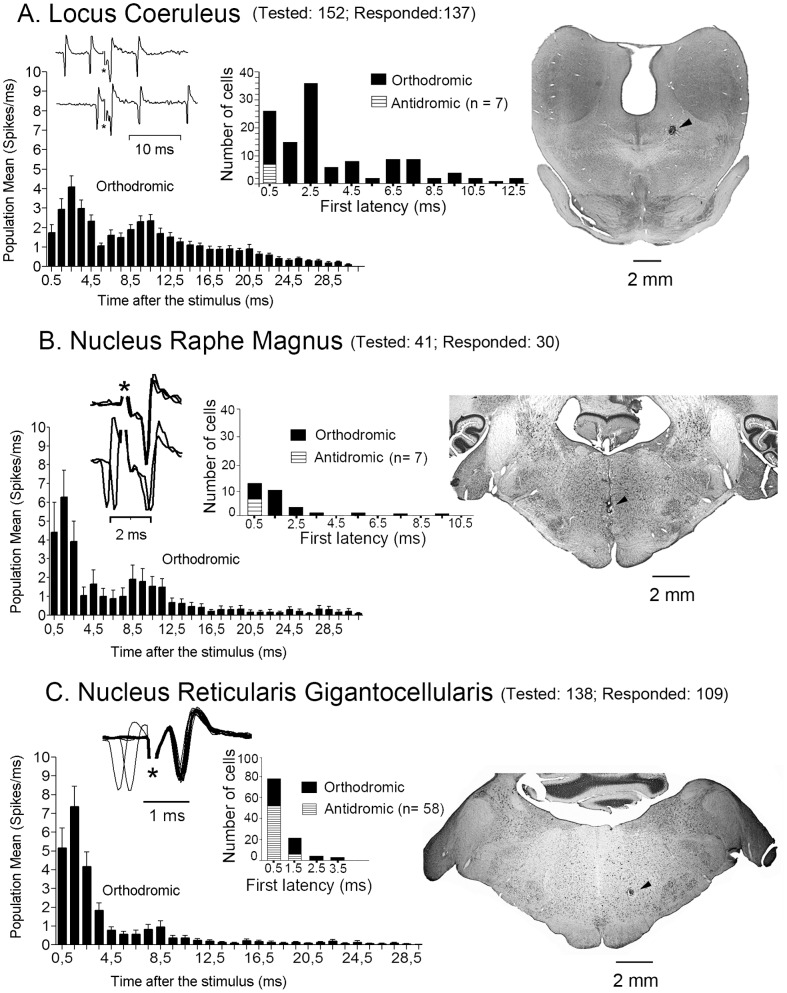
Figure 5. Population responses of SRD cells to LC, NRM and NRGc stimulation.
The poststimulus histograms at left were computed with the population means of spikes ± SEM from all cells responding orthodromically. Samples of short-latency responses (lack of collision) are shown over each poststimulus histogram. The latency distribution of the sampled cells are shown in the center histograms of each panel, and representative electrolytic lesions (signaled by arrowheads) made through the stimulating electrodes are shown in the coronal sections at right.

