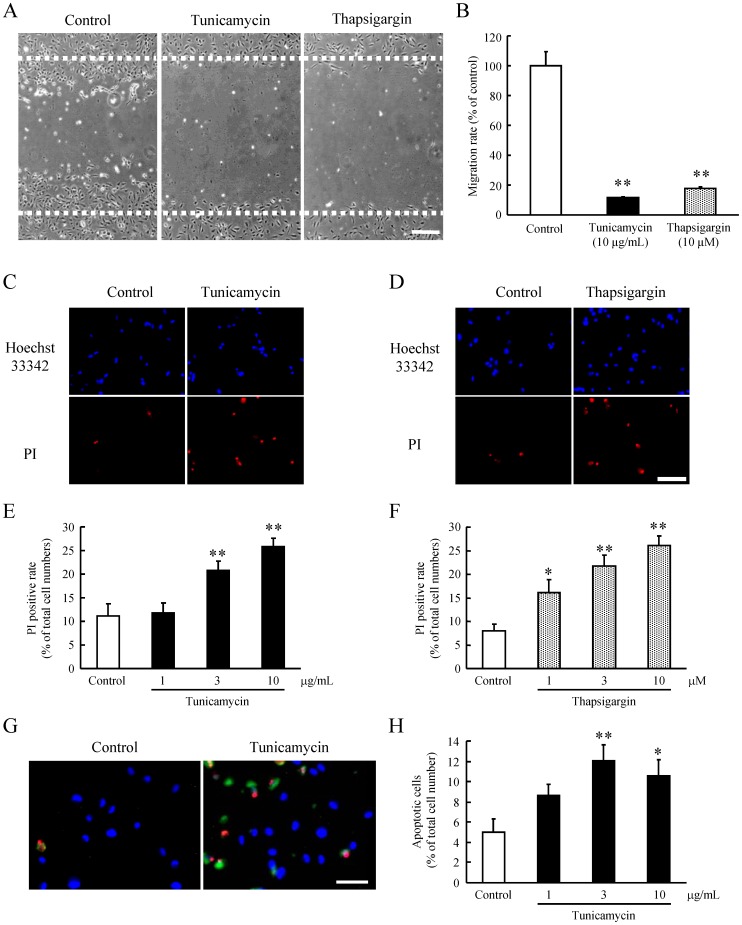
Figure 2. Severe ER stress-induced cell death of HRMEC via the apoptotis.
(A) Representative images of migration test with tunicamycin at 10 µg/mL and thapsigargin at 10 µM are shown. (B) Both tunicamycin at 10 µg/mL and thapsigargin at 10 µM inhibited the cell migration in HRMEC. Fluorescence micrographs of Hoechst 33342 and PI staining are shown at 24 h after treatment for 2 h with (C) tunicamycin or (D) thapsigargin. Scale bar represents 100 µm. The dead cells were increased with (E) tunicamycin or (F) thapsigargin. Data are shown as mean ± S.E.M. (n = 6). *, p<0.05; **, p<0.01 vs. Control (Dunnett's multiple-comparison test). (G) Fluorescence photomicrographs of HRMEC triple-stained with propidium iodide (PI), annexin V-FITC, and Hoechst 33342, with tunicamycin. Red: Propidium Iodide, Green: Annexin V, blue: Hoechst33342. Scale bar represents 100 µm. (H) The apoptotic cells were significantly increased with tunicamycin at 3 and 10 µg/mL. Scale bar represents 100 µm. Data are shown as mean ± S.E.M. (n = 4). *, p<0.05; **, p<0.01 vs. Control (Dunnett's multiple-comparison test).

