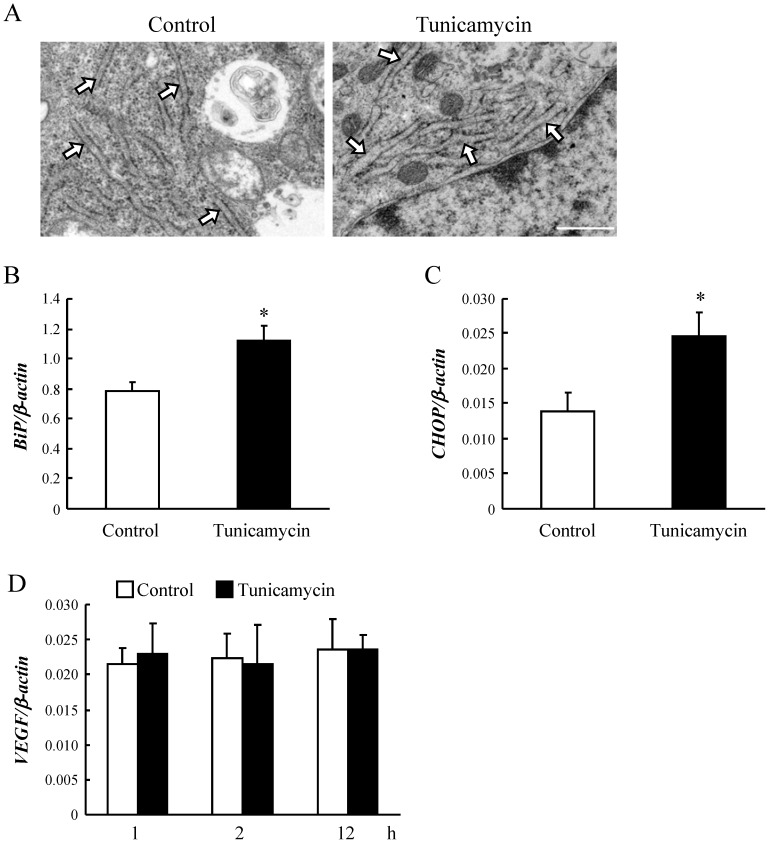
Figure 3. Tunicamycin at low concentration activated the transcription of BiP and CHOP mRNA with the mild dilation of ER in HRMEC.
(A) Electron microscopic images are shown for 2 h with tunicamycin at 0.1 µg/mL. Tunicamycin induced the mild dilation of endoplasmic reticulum (ER). Scale bar represents 500 nm. Arrows indicate the ER in HRMEC. The mRNA levels of (B) BiP and (C) CHOP in HRMEC were determined by real-time RT-PCR and normalized against β-actin. Data are shown as mean ± S.E.M. (n = 4 to 6). *, p<0.05 vs. Control (Student's t-test). (D) XBP-1 mRNA was not spliced by treatment with tunicamycin. HRMEC were harvested at 10 min, 30 min, 1 h, and 2 h after addition of tunicamycin, or at 10 and 22 h after incubation. Typical gel images of spliced or unspliced XBP-1 bands at each sampling point were generated by MCE-202 MultiNA, a microchip based capillary electrophoresis system for DNA analysis (n = 3 or 4). (E) The mRNA level of VEGF, as a common angiogenic factor, was determined by real-time RT-PCR before and after the induction of BiP mRNA and CHOP mRNA, but no differences were apparent between the control and tunicamycin treated groups. Data are shown as mean ± S.E.M. (n = 4 or 5). For 1 h, p = 0.80; for 2 h, p = 0.91; for 12 h, p = 0.99 vs. Control (Student's t-test).

