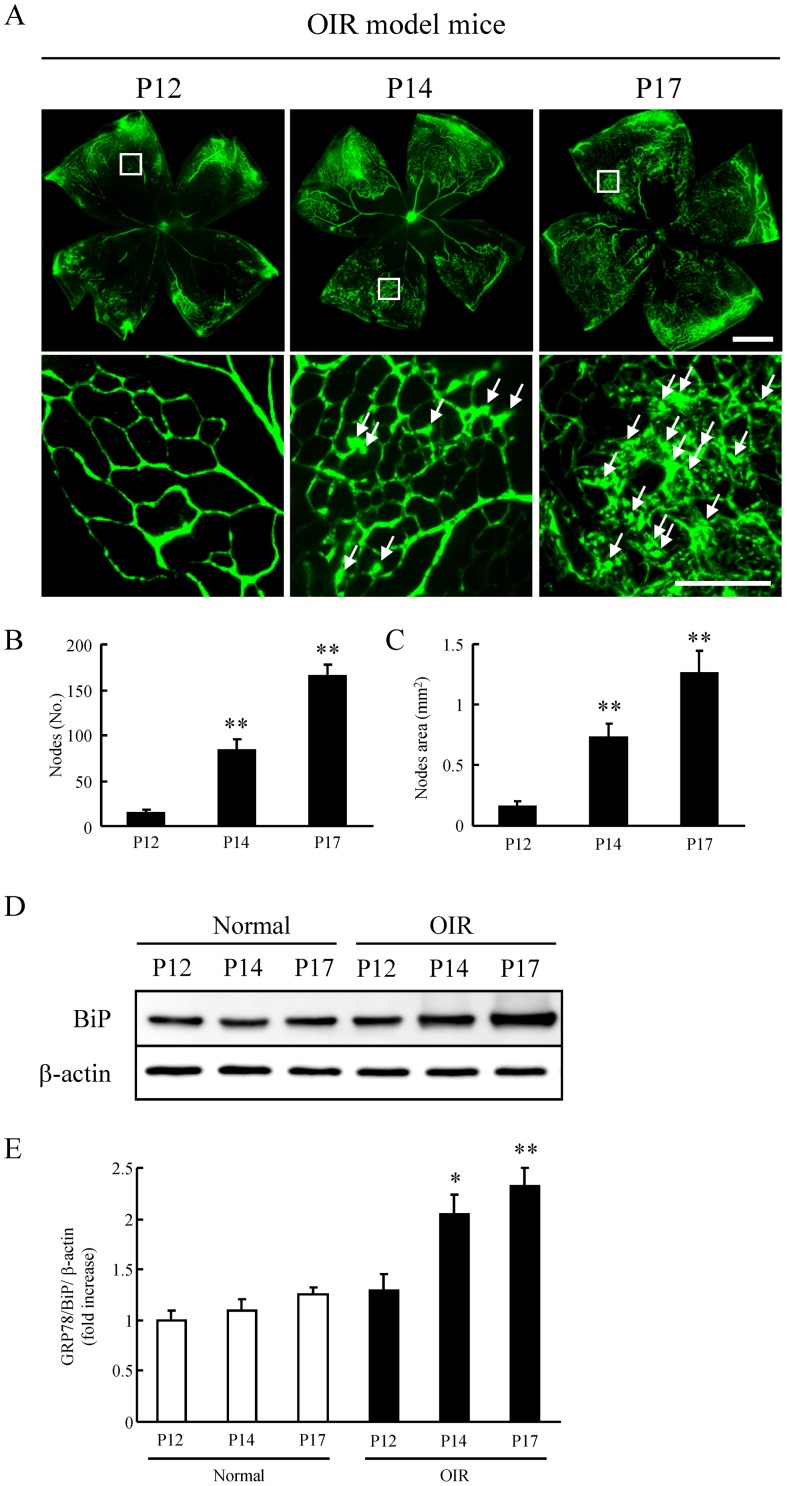
Figure 7. The expression of BiP was associated with retinal neovascularization of a murine oxygen-induced retinopathy (OIR) model.
(A) The representative photographs are shown the retinal flat-mount (the upper images) and the higher magnification version of part of the corresponding upper images (the lower images). Arrows indicate newly formed vessels anterior to internal limiting membrane. Scale bars indicate 500 µm (Upper images) and 100 µm (Lower images). Quantitative analysis was performed on the entire retinal microvasculature time-dependently. In the OIR model, retinal neovascularization at P14 and P17 significantly increased both the number of nodes (B) and the nodes area (C), compared to that at P12. In the retina of the same individual, BiP induction was caused time-dependently (D). Relative intensity was described by the intensity of BiP divided by β-actin (E). Data are shown as mean ± S.E.M. (n = 6 to 9). *, p<0.05, **, p<0.01 vs. OIR mice at P12 (Dunnett's multiple-comparison test).

